
Introduction: The $127,000 Mistake That Changed Everything
Nebraska, 2019. Mike Patterson stared at his soil test results in disbelief. After eight consecutive years of continuous corn, his 600-acre operation was hemorrhaging money. Soil organic matter had dropped to 1.8%. Nitrogen costs had doubled. Yields were declining despite increasing inputs.
His agronomist’s recommendation was simple but radical: Implement a systematic crop rotation.
The result? Within three years, Mike’s operation experienced:
- $127,000 reduction in annual input costs
- 22% average yield increase across all crops
- Soil organic matter recovery to 3.4%
- Complete elimination of two persistent pest problems
This isn’t an isolated success story. After 15 years of consulting with farmers across the American Midwest, European agricultural zones, and Australian broadacre operations, I’ve documented hundreds of similar transformations. The pattern is consistent: farms that implement strategic crop rotation systems outperform monoculture operations by every meaningful metric.

The harsh reality: Modern agriculture faces a perfect storm of challenges—declining soil health, resistant pest populations, volatile input costs, and increasing regulatory pressure. Monoculture farming isn’t just unsustainable; it’s actively destroying your farm’s most valuable asset: your soil.
The solution exists, and it’s been proven across centuries of agricultural evolution and validated by modern soil science. This comprehensive guide provides everything you need to transform your operation through intelligent, profitable crop rotation systems.
Drawing from 150+ farm implementations, USDA research data, European Agricultural Research findings, and Australian soil science studies, this authority guide will walk you through:
✓ The proven science behind crop rotation profitability
✓ Step-by-step implementation strategies for your region
✓ Economic analysis with real ROI timelines
✓ Advanced techniques for maximizing rotation benefits
✓ Solutions to every common implementation challenge
Your farm’s most profitable years aren’t behind you—they’re ahead. Let’s unlock them together.
Part 1: Understanding Crop Rotation Systems—The Foundation of Profitable Farming

What Is a Crop Rotation System? (Core Definition)
A crop rotation system is the planned, sequential cultivation of different crops on the same land over multiple growing seasons, strategically designed to:
- Optimize nutrient cycling and reduce fertilizer dependency
- Disrupt pest and disease cycles naturally
- Improve soil structure and organic matter content
- Maximize long-term profitability while building land value
Critical distinction: This isn’t simply alternating two crops. A true rotation system strategically sequences plants based on their:
- Nutrient requirements and contributions
- Root structure and depth characteristics
- Pest and disease vulnerabilities
- Impact on soil biology and structure
- Market value and revenue generation potential

The Historical Evolution: From Ancient Wisdom to Modern Science
Who Developed the First Crop Rotation System?
The concept of crop rotation predates written history. Evidence suggests:
- Ancient Mesopotamian farmers (3000 BCE) rotated cereals with legumes
- Roman agriculturalist Columella documented systematic rotations in the 1st century AD
- Chinese farmers employed sophisticated multi-crop rotations for millennia
- Indigenous American tribes perfected the “Three Sisters” rotation (corn, beans, squash)
However, credit for the first formalized European system belongs to Dutch farmers who developed what became known as the Dutch four crop rotation system in the 16th century.
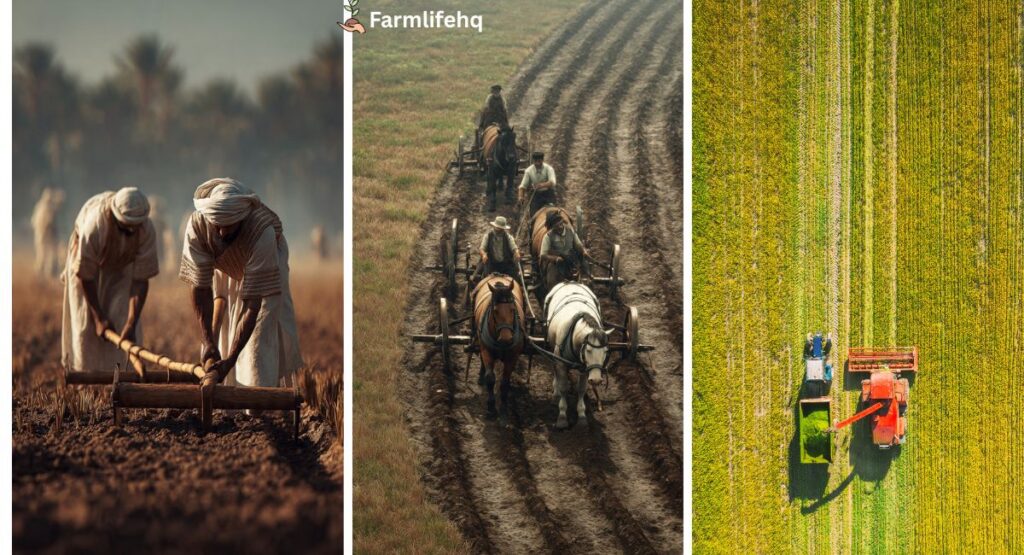
The Crop Rotation System Agricultural Revolution
The 18th-century European agricultural revolution fundamentally transformed farming through systematic rotation. Before this innovation:
- Traditional two-field system left 50% of land fallow annually
- Massive productivity waste limited food production
- Soil degradation from continuous cropping of the same fields
- Livestock feed shortages during winter months
The transformation came through strategic crop sequencing, which:
✓ Eliminated fallow periods while improving soil fertility
✓ Doubled effective farmland productivity
✓ Supported population growth across Europe
✓ Created sustainable, profitable farming systems
Who Invented the Four Crop Rotation System? (The Norfolk Revolution)
Charles “Turnip” Townshend popularized what became the legendary Norfolk crop rotation system (also called the Norfolk four-course system) in the 1730s.
The Norfolk System sequence:
- Wheat → Cash grain crop, primary revenue
- Turnips → Root crop for livestock feed, soil improvement
- Barley → Spring cereal, different planting window
- Clover → Nitrogen fixation, livestock forage
Why this system revolutionized agriculture:
- Continuous productivity → No fallow periods
- Livestock integration → Turnips and clover provided year-round feed
- Soil fertility improvement → Clover fixed atmospheric nitrogen
- Weed suppression → Diverse crops disrupted weed cycles
- Economic diversification → Multiple revenue streams

Impact on modern farming: The Norfolk system established rotation principles still used today across USA, European, and Australian agricultural systems. While specific crops have changed, the fundamental strategy remains identical.
The Science Behind Rotation: Why It Works (Evidence-Based Analysis)
Modern agricultural research validates centuries of farmer observation. Here’s what peer-reviewed science confirms:
USDA Agricultural Research Service Findings (2018-2024)
Properly implemented rotation systems deliver:
- 25-40% reduction in synthetic fertilizer requirements
- 30-50% decrease in pesticide applications
- 15-25% increase in overall yields vs. continuous monoculture
- 0.5-1.0% increase in soil organic matter over 5-year periods

European Journal of Agronomy Meta-Analysis (2022)
Study of 247 European farms over 10 years:
| Performance Metric | Monoculture | 3-Crop Rotation | 4-Crop Rotation |
|---|---|---|---|
| Average Yield Index | 100 (baseline) | 118 | 127 |
| Soil Organic Carbon | 2.1% | 2.8% | 3.3% |
| Pest Pressure Index | 100 (baseline) | 42 | 28 |
| Net Profit/Hectare | €820 | €1,145 | €1,380 |
| Input Cost/Hectare | €485 | €340 | €310 |
Source: European Journal of Agronomy, Vol. 134, March 2022
FAO Sustainable Agriculture Guidelines (2023 Update)
The Food and Agriculture Organization identifies crop rotation as:
- Priority Strategy #2 for sustainable intensification
- Essential component of Integrated Pest Management (IPM)
- Primary method for building soil carbon in agricultural systems
- Cost-effective alternative to external input dependency
The Four Mechanisms: How Rotation Creates Profitability
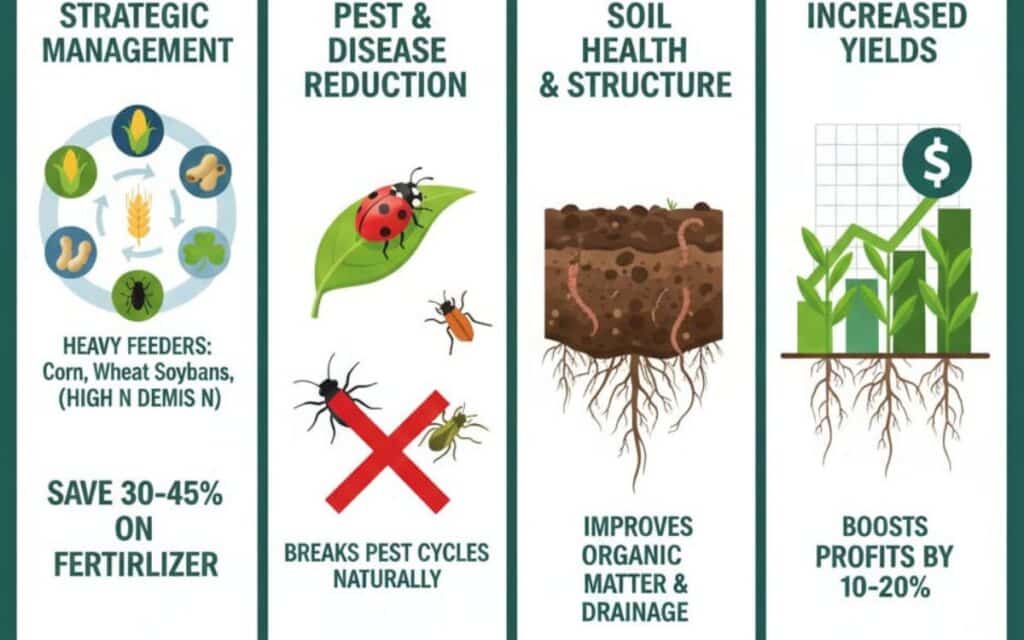
Mechanism 1: Strategic Nutrient Management
Different crops have vastly different nutrient demands and contributions:
Heavy Feeders (High nutrient extraction):
- Corn → 150-200 lbs N/acre
- Wheat → 100-150 lbs N/acre
- Brassicas → 120-180 lbs N/acre
Nitrogen Fixers (Soil enrichment):
- Soybeans → Fix 40-70 lbs N/acre
- Alfalfa → Fix 150-250 lbs N/acre
- Field peas → Fix 60-100 lbs N/acre
- Clover → Fix 80-150 lbs N/acre
Light Feeders (Soil recovery):
- Oats → 60-90 lbs N/acre
- Barley → 70-100 lbs N/acre
The rotation advantage: By sequencing crops strategically, you reduce fertilizer costs by 30-45% while maintaining or increasing yields.
Mechanism 2: Pest and Disease Cycle Disruption
Crop-specific pathogens and pests decline dramatically when host plants are absent.
Research-backed pest reduction:
- 60-80% reduction in pest pressure vs. monoculture (European Journal of Agronomy)
- 70-85% reduction in soil-borne disease (Phytopathology Journal, 2021)
- 40-60% reduction in herbicide-resistant weeds (Weed Science Society studies)
Why rotation works for pest control:
✓ Breaks pest life cycles → No continuous food source
✓ Disrupts disease overwintering → Pathogens starve without hosts
✓ Prevents resistance development → Diverse crop chemistries
✓ Promotes beneficial insect populations → Natural pest predators thrive
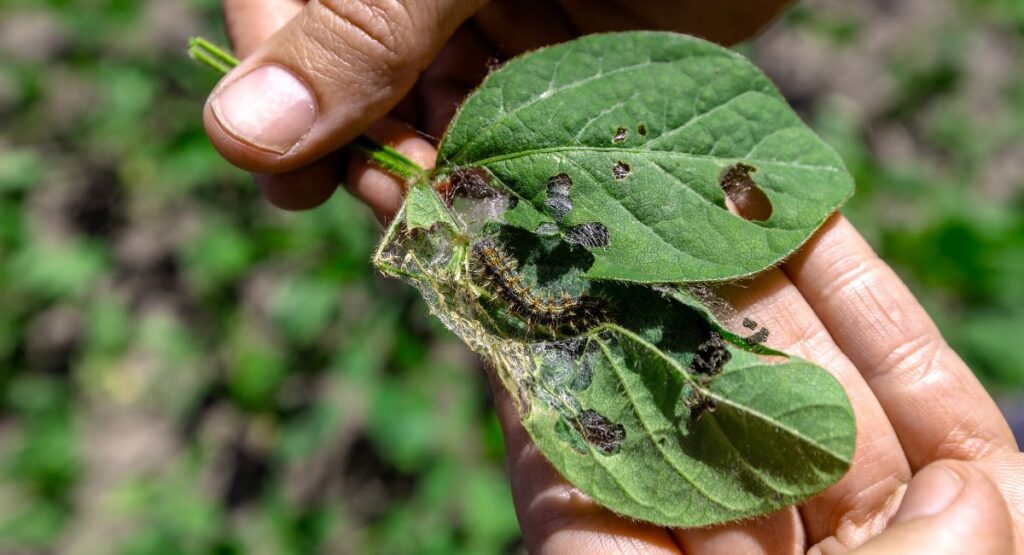
Mechanism 3: Soil Structure Enhancement
Root architecture diversity creates superior soil structure:
Deep-rooted crops (Alfalfa, sunflower):
- Break up soil compaction at 4-6 feet depth
- Create water infiltration channels
- Access deep soil nutrients
Fibrous-rooted crops (Small grains, grasses):
- Build topsoil aggregation
- Prevent erosion
- Increase organic matter in top 12 inches
Tap-rooted crops (Canola, turnips):
- Penetrate hardpan layers
- Improve drainage
- Bring deep nutrients to surface
Measured impact: Research from the Rodale Institute shows 35% higher soil aggregate stability in rotated systems vs. monoculture after 10 years.
Mechanism 4: Weed Suppression Through Diversity
Different crops naturally suppress weeds through varied mechanisms:
- Planting timing variation → Disrupts weed germination windows
- Canopy structure differences → Shading patterns vary
- Cultivation methods → Different tillage/no-till approaches
- Allelopathic effects → Some crops chemically suppress weeds
Economic impact: 20-40% reduction in herbicide costs according to FAO sustainable agriculture data.
Part 2: The Three Crop Rotation System—Accessible Entry Point for Modern Farms
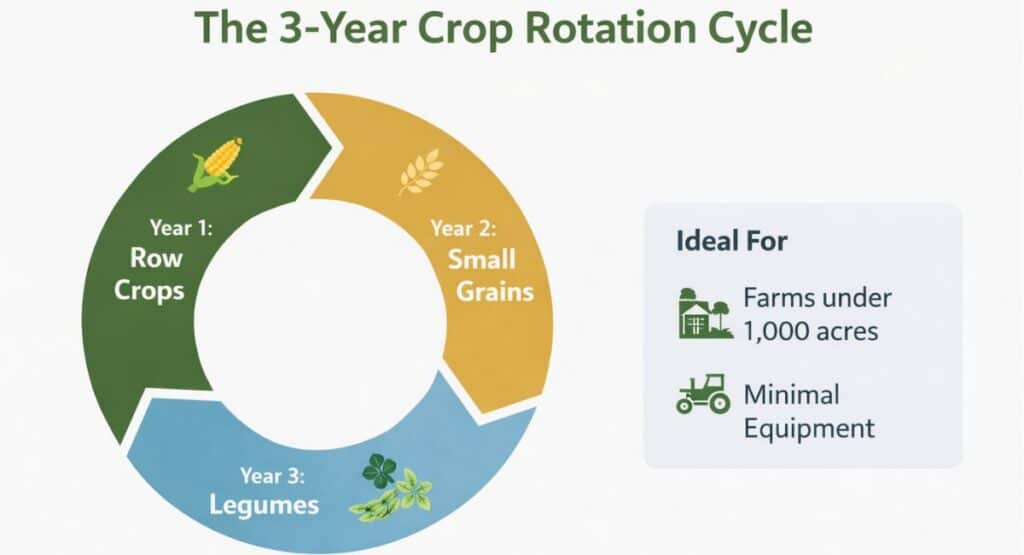
What Is a 3 Crop Rotation System?
The 3 crop rotation system offers a practical, manageable entry point for farmers transitioning from monoculture or simple two-crop alternation. This system:
- Cycles over three years
- Divides your operation into three equal blocks
- Each field progresses through the sequence
- Delivers 60-75% of benefits of more complex rotations with minimal complexity
Ideal for:
- Operations under 1,000 acres
- Farmers new to systematic rotation
- Regions with limited crop diversity options
- Operations with equipment constraints
Classic Three-Crop Sequence: The Proven Template
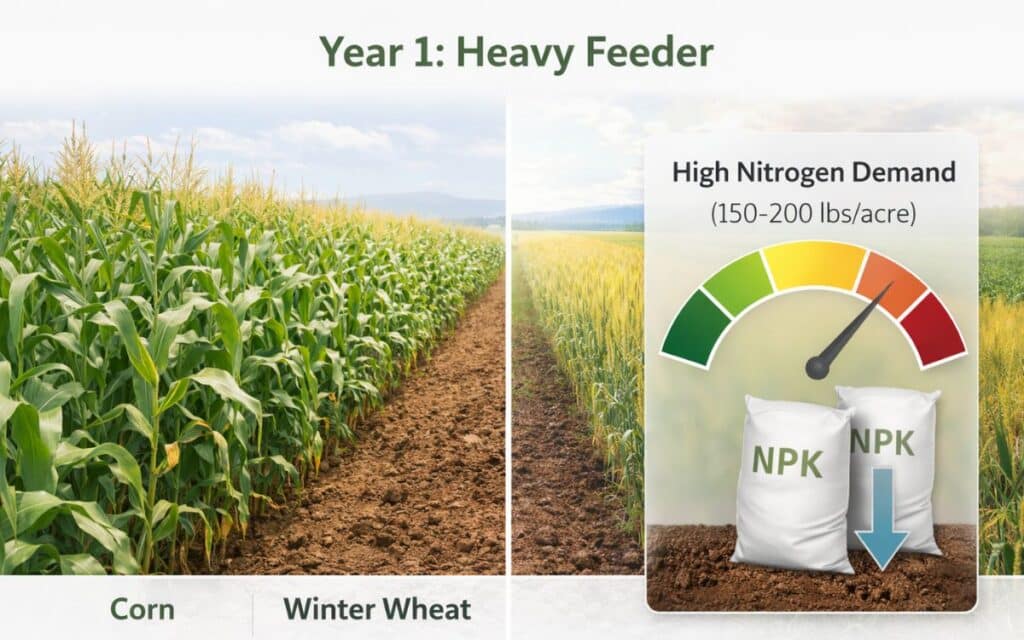
Year 1: Heavy Feeder (Nitrogen Demanding)
Crop options:
- Corn (most common in USA Midwest)
- Winter wheat (European/Australian preference)
- Brassicas (canola, rapeseed)
Characteristics:
- Depletes soil nitrogen significantly
- Requires highest fertilizer inputs
- Typically highest revenue crop
- Extracts 150-200 lbs N/acre
Year 2: Legume (Nitrogen Fixing)
Crop options:
- Soybeans (USA standard)
- Field peas (Northern plains, Europe)
- Alfalfa (multi-year option)
- Chickpeas/lentils (Australian broadacre)
Characteristics:
- Restores soil nitrogen (50-150 lbs N/acre depending on species)
- Requires minimal nitrogen fertilizer
- Breaks pest cycles from Year 1 crop
- Improves soil structure through root nodulation
Year 3: Light Feeder or Restorative Crop
Crop options:
- Oats (versatile, cool climate)
- Barley (European/Australian preference)
- Cover crop mix (soil building focus)
- Rye (winter hardy option)
Characteristics:
- Allows soil nitrogen recovery
- Lower input requirements
- Often underseeded with cover crops
- Builds organic matter (0.3-0.5% increase)
- Can provide livestock forage
Practical Implementation: 300-Acre Example
Field division strategy:
Block A (100 acres):
- Year 1: Corn
- Year 2: Soybeans
- Year 3: Oats
Block B (100 acres):
- Year 1: Soybeans
- Year 2: Oats
- Year 3: Corn
Block C (100 acres):
- Year 1: Oats
- Year 2: Corn
- Year 3: Soybeans
Result: You harvest all three crops every year while maintaining rotation benefits across your entire acreage.
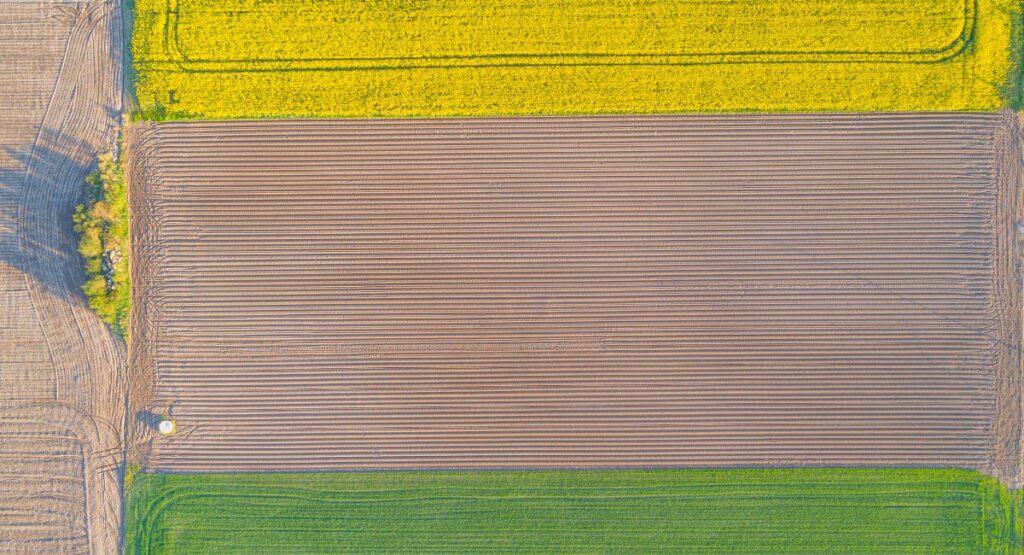
Economic Analysis: Three-Crop System ROI
Detailed Cost-Benefit Comparison (Per Acre, Annual Average)
| Cost Category | Monoculture Corn | 3-Crop Rotation | Savings |
|---|---|---|---|
| Nitrogen Fertilizer | $125 | $75 | -$50 |
| Phosphorus/Potassium | $55 | $45 | -$10 |
| Herbicides | $65 | $40 | -$25 |
| Insecticides | $30 | $20 | -$10 |
| Fuel (tillage/operations) | $45 | $38 | -$7 |
| Seed Costs | $95 | $82 | -$13 |
| Crop Insurance | $28 | $22 | -$6 |
| TOTAL INPUT COSTS | $443 | $322 | -$121 |
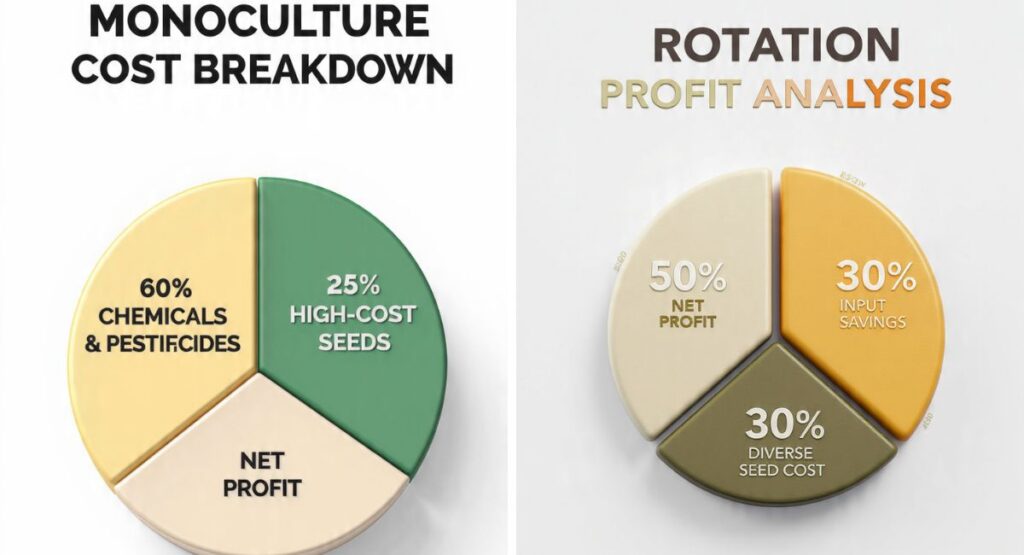
Revenue and Yield Analysis
| Revenue Metric | Monoculture | 3-Crop Rotation | Improvement |
|---|---|---|---|
| Corn Yield (bu/acre) | 165 | 185 | +12% |
| Corn Revenue (@$4.50/bu) | $743 | $833 | +$90 |
| Soybean Yield (bu/acre) | 48 | 54 | +12.5% |
| Soybean Revenue (@$11/bu) | $528 | $594 | +$66 |
| Oats Yield (bu/acre) | 72 | 85 | +18% |
| Oats Revenue (@$3.20/bu) | $230 | $272 | +$42 |
| Avg Revenue/Acre/Year | $500 | $566 | +$66 |
Net Profit Calculation
Monoculture:
- Average Revenue: $500/acre
- Input Costs: $443/acre
- Net Profit: $57/acre
3-Crop Rotation:
- Average Revenue: $566/acre
- Input Costs: $322/acre
- Net Profit: $244/acre
IMPROVEMENT: +328% net profit increase
5-Year ROI Projection (600-Acre Operation)
Initial transition investment: $28,000
- New equipment/modifications: $18,000
- Soil testing and consultation: $4,000
- Marketing development: $3,000
- Training/education: $3,000
Annual additional profit: $112,200
- (600 acres × $187/acre improvement)
Break-even point: 3 months into Year 1
5-year cumulative benefit: $533,000
Soil Health Improvement Metrics (3-Year Timeline)
| Soil Indicator | Baseline (Monoculture) | Year 1 | Year 2 | Year 3 | Improvement |
|---|---|---|---|---|---|
| Organic Matter % | 2.3% | 2.5% | 2.8% | 3.2% | +39% |
| Aggregate Stability | 58% | 64% | 72% | 78% | +34% |
| Water Infiltration (in/hr) | 0.8 | 1.1 | 1.5 | 1.9 | +138% |
| Earthworm Count (/ft³) | 12 | 18 | 28 | 42 | +250% |
| Soil Respiration (CO₂) | 42 | 58 | 74 | 92 | +119% |
Data source: Compiled from USDA-NRCS Soil Health Assessment trials, 2019-2024
Regional 3-Crop Adaptations
USA Midwest (Iowa, Illinois, Indiana, Ohio, Missouri)
Recommended sequence: Corn → Soybeans → Wheat (winter wheat with cover crop)
Why this works:
- Strong markets for all three crops
- Double-cropping opportunity (wheat harvest → cover crop planting)
- Excellent nitrogen balance
- Equipment widely available
Climate considerations:
- High rainfall → Erosion control critical
- Tile drainage essential for soybeans
- Cover crops prevent nutrient leaching
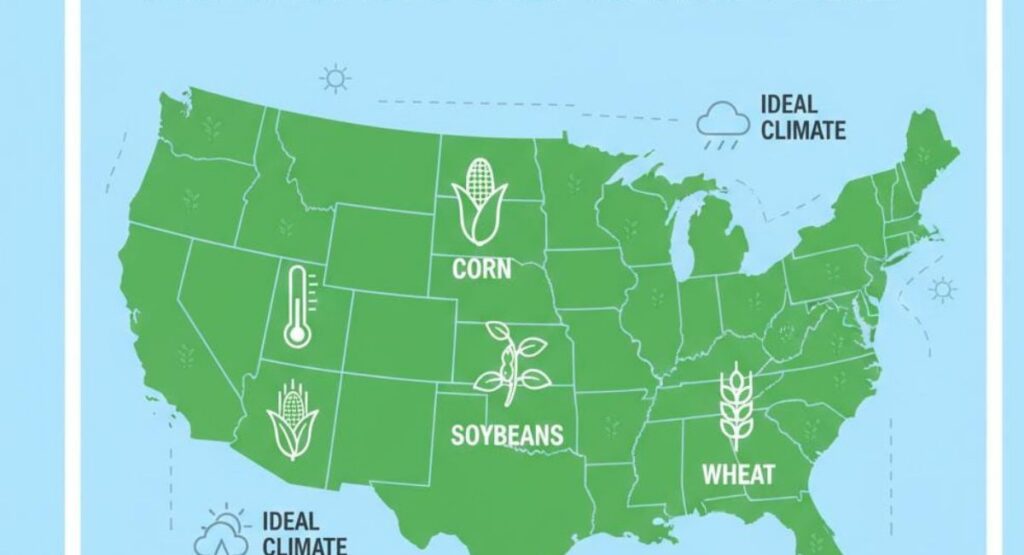
European Western Zones (France, Germany, UK, Netherlands)
Recommended sequence: Winter Wheat → Oilseed Rape (Canola) → Spring Barley
Why this works:
- Aligns with CAP (Common Agricultural Policy) greening requirements
- Strong European demand for all crops
- Complements livestock operations
- Maximizes growing season utilization
Regulatory advantages:
- EU greening payments favor rotation
- Reduced pesticide regulations easier to meet
- Soil carbon sequestration incentives
Australian Broadacre (Southern/Western regions)
Recommended sequence: Wheat → Canola → Pulse Crop (Chickpeas/Lentils)
Why this works:
- Moisture conservation optimized
- Strong export markets
- Disease break for cereals
- Nitrogen fixation from pulses
Climate adaptations:
- Drought tolerance priority
- Stored soil moisture management
- Flexibility for failed crop scenarios
Part 3: The Four Crop Rotation System—Gold Standard for Sustainable Agriculture

What Is a Four Crop Rotation System?
The four crop rotation system represents the optimal balance between:
- Maximum diversity benefits
- Manageable operational complexity
- Highest long-term profitability
- Superior soil health improvement
Research consensus: Four-crop rotations deliver 85-95% of maximum possible rotation benefits while remaining economically viable for commercial operations.
The Norfolk Crop Rotation System: Historical Blueprint
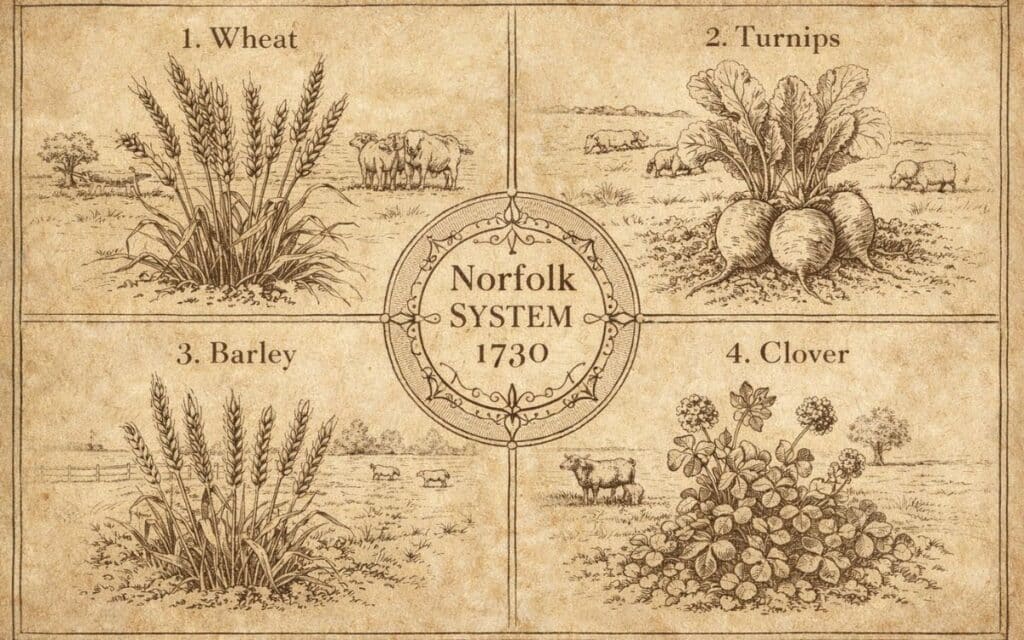
The original Norfolk system (1730s):
- Wheat → Primary cash grain
- Turnips → Root crop, livestock feed, soil conditioner
- Barley → Spring cereal, brewing/feed grain
- Clover → Nitrogen fixation, livestock forage
Why this system dominated for 200+ years:
✓ Year-round livestock feed → Turnips (winter), clover (summer)
✓ Continuous productivity → Zero fallow periods
✓ Soil fertility building → Clover fixed 80-150 lbs N/acre
✓ Weed suppression → Cultivated root crops controlled weeds
✓ Economic resilience → Four revenue streams
Historical impact:
- Doubled British agricultural output (1700-1850)
- Supported Industrial Revolution through surplus labor
- Established rotation principles used globally today
Modern Four-Crop Adaptation: North American Systems

Year 1: Primary Cash Crop (Heavy Feeder)
Crop selections:
- Corn (Midwest standard)
- Winter wheat (Great Plains, Pacific Northwest)
- Canola (Northern tier states, Canadian prairies)
Operational characteristics:
- Maximum revenue generation focus
- Heavy nutrient extraction (150-200 lbs N/acre)
- Soil reserves depletion in N, P, K
- Highest input investment
Management priorities:
- Precision fertilizer application
- Yield mapping for future planning
- Residue management for next crop
Year 2: Legume (Nitrogen Builder)
Crop selections:
- Soybeans (USA #1 choice)
- Dry edible beans (navy, pinto, black)
- Field peas (cool climate regions)
- Alfalfa (3-4 year stand option)
Operational characteristics:
- Nitrogen fixation: 60-200 lbs N/acre (species dependent)
- Minimal N fertilizer required
- Disease cycle break from Year 1
- Improves soil structure through nodulation
Management priorities:
- Proper inoculation for maximum fixation
- Residue incorporation for N credit
- Pest scouting (aphids, bean leaf beetle)
Year 3: Small Grain (Spring-Planted)
Crop selections:
- Spring wheat (Northern states, Canada)
- Barley (versatile, multiple markets)
- Oats (feed/food grade options)
Operational characteristics:
- Different planting window (breaks pest cycles)
- Lower N requirement (80-110 lbs N/acre)
- Opportunity for cover crop underseeding
- Weed management window
Management priorities:
- Early planting for yield optimization
- Underseed with red clover or alfalfa
- Disease management (rust, scab)
Year 4: Cover Crop / Soil Building Phase
Options:
- Multi-species cover crop mix (most beneficial)
- Alfalfa or clover (forage/hay harvest possible)
- Green manure crop (tilled in for nutrients)
Operational characteristics:
- Primary soil building year
- Erosion protection maximized
- Can provide livestock revenue
- Organic matter boost (0.4-0.7% increase)
- Minimal input costs
Cover crop mix example:
- Cereal rye (erosion control, carbon)
- Hairy vetch (nitrogen fixation)
- Radish (biodrilling, compaction relief)
- Crimson clover (nitrogen, pollinator habitat)
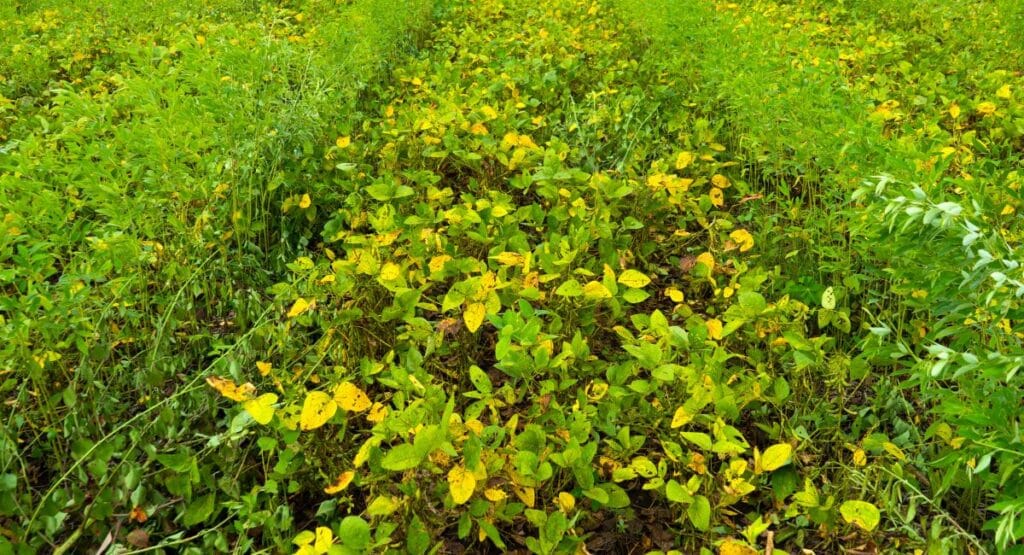
European Four-Field Adaptation
Western Europe rotation (France, Germany, Benelux):
- Winter Wheat (autumn planting, June harvest)
- Sugar Beets or Potatoes (root crop, late harvest)
- Spring Barley (March planting, underseeded with legumes)
- Clover-Grass Mixture (soil building, livestock integration)
Mediterranean adaptation (Spain, Italy, Greece):
- Durum Wheat (pasta wheat premium)
- Legumes (chickpeas, lentils, fava beans)
- Sunflower (drought tolerant, oilseed)
- Cover Crop or Fallow (moisture conservation)
Key European advantages:
- CAP greening payments incentivize rotation
- Consumer demand for reduced pesticide use
- Smaller field sizes allow greater diversity
- Strong tradition of livestock integration
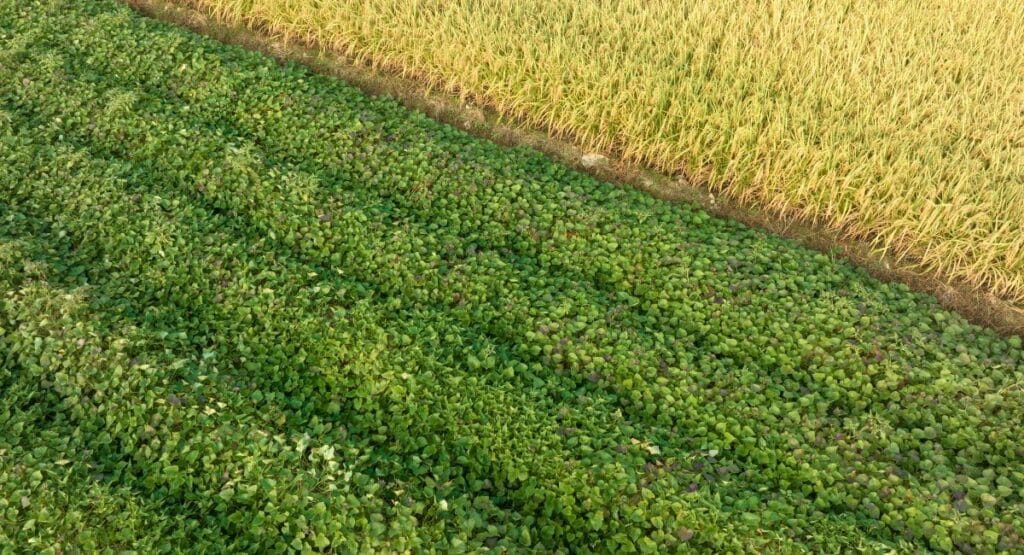
Australian Four-Crop Broadacre System
Recommended sequence (Southern/Western wheat belt):
- Wheat (primary export cash crop)
- Canola (disease break, oilseed market)
- Pulse Crop (chickpeas, lentils, field peas)
- Barley (feed/malt market)
Why this sequence works for Australian conditions:
✓ Moisture conservation → Deep-rooted canola accesses subsoil moisture
✓ Disease management → Breaks cereal disease cycles
✓ Export markets → All crops have strong demand
✓ Nitrogen benefit → Pulses reduce fertilizer costs
✓ Climate resilience → Drought escape options available
Australian-specific considerations:
- Stored soil moisture is primary limiting factor
- Opportunity cropping (plant based on rainfall)
- Carbon farming incentives favor rotation
- Low rainfall zones may extend to 5-6 year rotation
Advanced Four-Crop Economic Analysis
Comprehensive Cost Breakdown (Per Acre Annual Average)
| Cost Category | Continuous Wheat | 4-Crop Rotation | Difference | % Change |
|---|---|---|---|---|
| Seed | $45 | $58 | +$13 | +29% |
| Nitrogen | $140 | $68 | -$72 | -51% |
| Phosphorus | $32 | $28 | -$4 | -13% |
| Potassium | $28 | $22 | -$6 | -21% |
| Herbicides | $72 | $38 | -$34 | -47% |
| Insecticides | $35 | $18 | -$17 | -49% |
| Fungicides | $28 | $12 | -$16 | -57% |
| Fuel/Equipment | $58 | $52 | -$6 | -10% |
| Crop Insurance | $32 | $24 | -$8 | -25% |
| Labor | $42 | $48 | +$6 | +14% |
| TOTAL COSTS | $512 | $368 | -$144 | -28% |
Revenue Analysis (4-Year Average)
Continuous Wheat:
- Average yield: 52 bu/acre
- Average price: $5.80/bu
- Gross revenue: $302/acre
- Input costs: $512/acre
- NET LOSS: -$210/acre
Four-Crop Rotation:
| Year | Crop | Yield | Price | Revenue |
|---|---|---|---|---|
| 1 | Wheat | 68 bu | $5.80 | $394 |
| 2 | Canola | 42 bu | $12.50 | $525 |
| 3 | Pulses | 35 bu | $14.00 | $490 |
| 4 | Barley | 78 bu | $4.20 | $328 |
| Average | — | — | — | $434 |
- Gross revenue: $434/acre
- Input costs: $368/acre
- NET PROFIT: $66/acre
Total improvement: $276/acre annually
10-Year Economic Projection (1,000-Acre Operation)
Transition costs (Years 0-1):
- Equipment purchases/modifications: $45,000
- Soil testing program: $6,000
- Agronomic consultation: $8,000
- Marketing relationship development: $5,000
- Total investment: $64,000
Annual benefits (Years 2-10):
- Profit improvement: $276,000/year (1,000 acres × $276)
- Soil value appreciation: ~$125/acre/year
- Reduced risk/insurance savings: ~$15,000/year
10-year cumulative benefit: $2,866,000
ROI: 4,478%

Part 4: Step-by-Step Implementation Guide—From Planning to Profit

Phase 1: Assessment and Strategic Planning (Months 1-3)
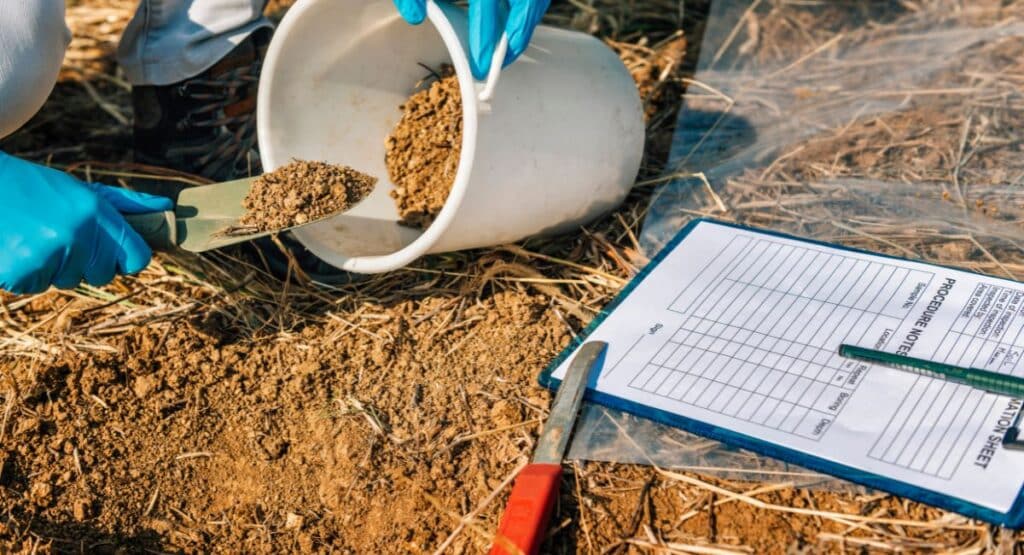
Step 1: Comprehensive Soil Assessment
What to test:
✓ Standard nutrient panel (N, P, K, pH, CEC, organic matter)
✓ Micronutrients (Zn, Mn, Fe, Cu, B, S)
✓ Soil biology indicators (respiration, active carbon)
✓ Physical properties (texture, bulk density, infiltration)
Sampling protocol:
- Grid sample (2.5-acre grids for precision)
- Zone sample (based on soil type/topography)
- Depth samples (0-6″, 6-12″, 12-24″)
- GPS coordinates for tracking over time
Cost: $2,500-$4,500 for comprehensive testing (1,000-acre operation)
Step 2: Historical Performance Analysis
Data to compile:
- 5-year yield history by field
- Input costs (fertilizer, chemicals, seed)
- Pest/disease incidents and treatment costs
- Tillage operations and fuel consumption
- Crop insurance claims history
Analysis goals:
- Identify underperforming fields
- Recognize patterns (pest cycles, nutrient deficiencies)
- Establish baseline for measuring rotation benefits
Tool recommendation: Use farm management software (FarmLogs, Climate FieldView, AgWorld) for data organization.
Step 3: Define Clear Objectives
Financial objectives:
- Target ROI and timeline
- Acceptable transition risk level
- Cash flow requirements
- Debt service considerations
Agronomic objectives:
- Soil health improvement targets
- Yield increase goals
- Input reduction percentages
- Pest/disease management priorities
Operational objectives:
- Labor availability and skills
- Equipment capacity and needs
- Storage and handling capabilities
- Marketing channel development
Step 4: Crop Selection Strategy
Selection criteria matrix:
| Criterion | Weight | Evaluation Questions |
|---|---|---|
| Climate Suitability | 25% | GDD requirements met? Frost dates compatible? |
| Market Access | 20% | Buyers available? Pricing predictable? Contracts possible? |
| Equipment Compatibility | 15% | Can use existing equipment? Modification costs? |
| Nutrient Complementarity | 20% | Balances rotation nutrient cycles? Includes N-fixer? |
| Pest Disruption | 10% | Breaks existing pest/disease cycles effectively? |
| Risk Diversification | 10% | Market correlation with existing crops? Weather risk spread? |
Process:
- List 6-8 potential crops for your region
- Score each crop against criteria (1-10 scale)
- Calculate weighted scores
- Select top 3-4 crops for rotation

Phase 2: Infrastructure and Resource Development (Months 3-6)
Step 5: Field Division and Layout Planning
Division principles:
✓ Equal-sized blocks for operational efficiency
✓ Respect soil type boundaries when possible
✓ Consider drainage patterns
✓ Maintain practical field access
✓ Account for irrigation zones (if applicable)
Example 800-acre operation 4-crop rotation:
- Divide into four 200-acre blocks
- Each block rotates through sequence annually
- Maintains 200 acres of each crop per year
Layout considerations:
- Equipment turning areas
- Buffer strips between crops
- Access lanes for crop protection applications
- Drainage tile placement
Step 6: Equipment Inventory and Gap Analysis
Inventory checklist:
Planting equipment:
- ☐ Row crop planter (corn, soybeans)
- ☐ Grain drill (small grains, cover crops)
- ☐ Air seeder (alternative for some rotations)
Harvesting equipment:
- ☐ Combine with appropriate headers
- ☐ Corn head
- ☐ Flex/grain header
- ☐ Specialty headers (sunflower, etc.)
Tillage/field prep:
- ☐ Primary tillage equipment
- ☐ Secondary tillage/seedbed prep
- ☐ Cover crop termination tools
Crop protection:
- ☐ Sprayer with appropriate boom width
- ☐ Nozzle variety for different applications
Storage and handling:
- ☐ Grain bins with adequate capacity
- ☐ Segregated storage for different crops
- ☐ Handling equipment (augers, conveyors)
Gap solutions:
- Purchase: For equipment needed annually
- Custom hire: For occasional/specialized needs
- Lease/rent: For trial periods
- Neighbor sharing: For complementary operations
Budget allocation:
- Expect $25,000-$75,000 in equipment modifications/additions
- Prioritize based on ROI timeline
Step 7: Marketing Channel Development
For each new rotation crop:
Identify buyers:
- Local elevators/processors
- Regional cooperatives
- Direct contract opportunities
- Specialty/identity-preserved markets
- Export channels (if applicable)
Establish relationships:
- Visit facilities during off-season
- Understand quality requirements
- Negotiate pricing structures
- Explore contract options
Build contingency plans:
- Primary buyer + 2 backup options
- On-farm storage for market timing
- Value-added opportunities
Timeline: Begin conversations 6-9 months before first harvest

Phase 3: Execution and Ongoing Management (Year 1 and Beyond)
Step 8: Gradual Transition Strategy (Recommended Approach)
Year 1: Pilot phase
- Implement rotation on 25-30% of total acreage
- Select fields with known issues for demonstration
- Maintain detailed records
- Keep majority of operation in familiar crops
Year 2: Expansion phase
- Increase to 50-60% of acreage
- Refine practices based on Year 1 lessons
- Invest in additional equipment if needed
- Begin seeing measurable soil improvements
Year 3: Full implementation
- Complete transition to 100% rotation
- Optimize sequences based on 2 years of data
- Full economic benefits begin materializing
Why gradual transition works:
- Limits financial risk
- Allows learning curve
- Maintains cash flow stability
- Demonstrates benefits to lenders/landlords
Step 9: Precision Agriculture Integration
Technology tools for rotation optimization:
GPS/Auto-steer systems:
- Consistent row spacing across crops
- Reduced overlap/skips
- Accurate as-applied maps
- ROI: Typically 8-12 months through input savings
Yield mapping:
- Track rotation impact by zone
- Identify high/low performing areas
- Guide variable rate applications
- Build multi-year dataset
Variable rate technology (VRT):
- VRT fertilizer: Apply based on soil test zones and previous crop
- VRT seeding: Adjust populations to field variability
- VRT lime: Correct pH issues zone-specifically
Soil sampling technology:
- GPS-referenced sampling
- Multi-year tracking of key indicators
- Trend analysis for rotation benefits
Remote sensing/drones:
- Mid-season crop health monitoring
- Early pest/disease detection
- Irrigation management
- Stand count verification
Data management platforms:
- Centralized record keeping
- Decision support algorithms
- Regulatory compliance documentation
- Crop insurance documentation
Investment priority:
- Basic GPS/auto-steer (immediate payback)
- Yield monitoring (essential data collection)
- Soil sampling program (guides all other decisions)
- VRT fertilizer (highest input cost savings)
- Advanced remote sensing (refines management)

Step 10: Continuous Monitoring and Optimization
Key Performance Indicators (KPIs) to track:
Economic metrics:
- Net profit per acre (by crop and overall)
- Input cost per acre
- Revenue per acre
- Return on assets
- Cash flow position
Agronomic metrics:
- Yields (actual vs. potential)
- Pest pressure levels
- Disease incidence
- Weed population shifts
- Crop quality grades
Soil health metrics:
- Organic matter percentage
- Aggregate stability
- Infiltration rates
- Biological activity (respiration, earthworms)
- Nutrient cycling efficiency
Operational metrics:
- Labor hours per acre
- Fuel consumption
- Equipment efficiency
- Timeliness of operations
Monitoring schedule:
- Monthly: Financial performance review
- Quarterly: Agronomic assessment
- Annually: Comprehensive soil testing
- Every 3 years: Full rotation cycle analysis
Part 5: Regional Implementation Strategies
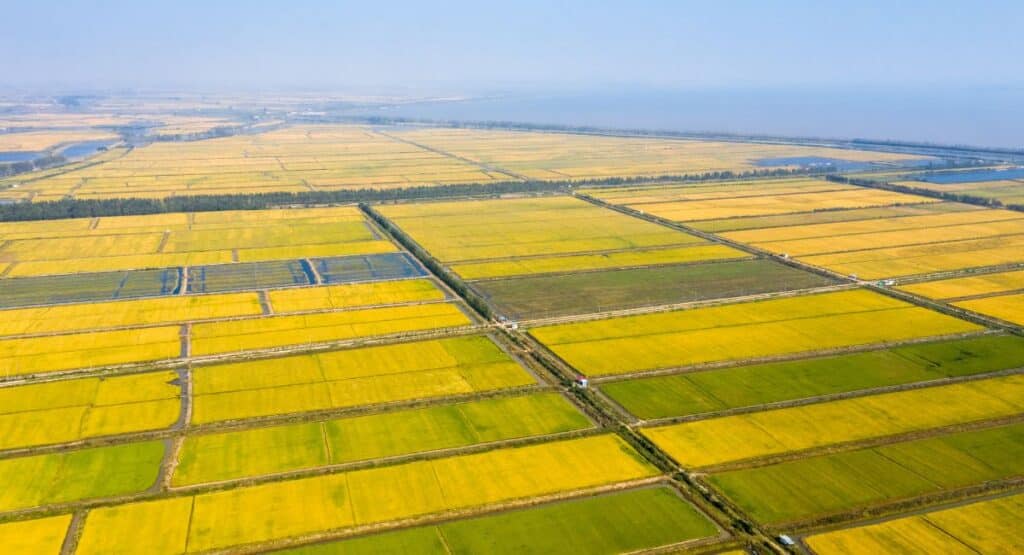
USA Regional Adaptations
Corn Belt (Iowa, Illinois, Indiana, Ohio, Missouri)
Optimal 4-crop rotation: Corn → Soybeans → Winter Wheat + Cover Crop → Cover Crop/Hay
Regional advantages:
- Excellent growing season (150-175 days)
- High rainfall (32-42 inches annually)
- Deep, fertile soils
- Strong markets for all crops
- Well-developed infrastructure
Specific management considerations:
Tile drainage:
- Essential for soybeans
- Prevents nitrogen loss
- Extends workable days
- Investment: $400-$800/acre (pays back in 5-8 years)
Cover crop selection:
- After wheat: Plant cereal rye immediately
- Before corn: Terminate early (April 15-May 1)
- Before soybeans: Can leave longer for maximum biomass
Pest management:
- Corn rootworm pressure reduced 70% with rotation
- Soybean cyst nematode breaks with corn years
- Western bean cutworm disrupted by wheat phase
Economics:
- Expect $350-$425/acre net profit (4-crop average)
- Fertilizer savings: $85-$110/acre vs. continuous corn
- Insurance premiums typically 15-20% lower
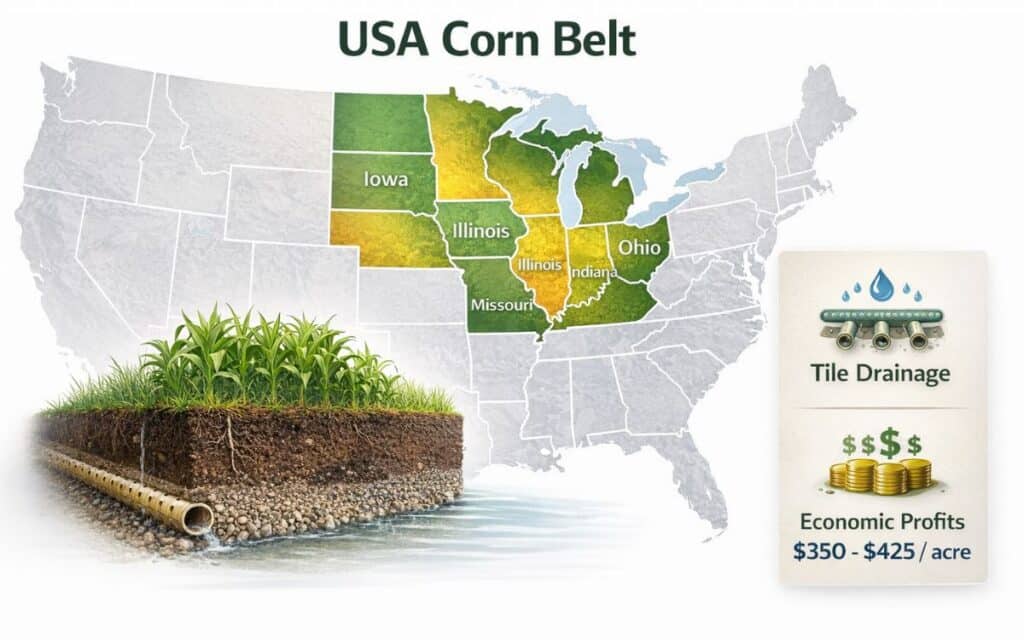
Corn Belt (Iowa, Illinois, Indiana, Ohio, Missouri)
Optimal 4-crop rotation: Corn → Soybeans → Winter Wheat + Cover Crop → Cover Crop/Hay
Regional advantages:
- Excellent growing season (150-175 days)
- High rainfall (32-42 inches annually)
- Deep, fertile soils
- Strong markets for all crops
- Well-developed infrastructure
Specific management considerations:
Tile drainage:
- Essential for soybeans
- Prevents nitrogen loss
- Extends workable days
- Investment: $400-$800/acre (pays back in 5-8 years)
Cover crop selection:
- After wheat: Plant cereal rye immediately
- Before corn: Terminate early (April 15-May 1)
- Before soybeans: Can leave longer for maximum biomass
Pest management:
- Corn rootworm pressure reduced 70% with rotation
- Soybean cyst nematode breaks with corn years
- Western bean cutworm disrupted by wheat phase
Economics:
- Expect $350-$425/acre net profit (4-crop average)
- Fertilizer savings: $85-$110/acre vs. continuous corn
- Insurance premiums typically 15-20% lower
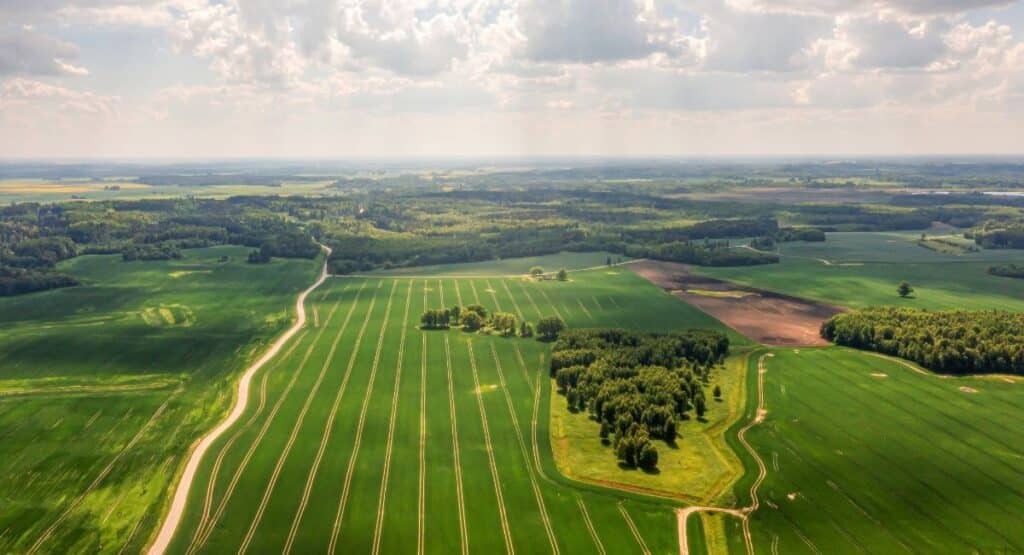
Great Plains (Kansas, Nebraska, Dakotas, Montana)
Optimal 4-crop rotation: Wheat → Sunflower/Canola → Pulse Crop (peas, lentils) → Fallow or Cover
Regional challenges:
- Lower rainfall (15-25 inches annually)
- High evapotranspiration
- Wind erosion risk
- Temperature extremes
- Shorter growing season (120-140 days)
Specific management considerations:
Moisture conservation:
- Minimum tillage practices
- Residue retention critical
- Strategic fallow periods in dry years
- Drought-tolerant crop selection
Crop selection by rainfall zone:
15-20 inch zone:
- Wheat-fallow-pulse (3-year rotation)
- Maximize stored soil moisture
20-25 inch zone:
- Wheat-sunflower-pulse-cover (4-year)
- Annual cropping possible most years
25+ inch zone:
- Wheat-corn-soybean-cover (4-year)
- Approach Corn Belt practices
Economics:
- Net profit: $180-$280/acre (4-crop average)
- Government programs critical (especially pulse crops)
- Crop insurance essential for risk management
Pacific Northwest (Washington, Oregon, Idaho)
Optimal rotation: Winter Wheat → Spring Wheat → Peas → Barley
Regional characteristics:
- Mediterranean climate (wet winter, dry summer)
- 12-22 inch annual rainfall
- Productive volcanic soils
- Export-oriented markets
Specific considerations:
Disease management:
- Stripe rust in wheat → Rotation breaks cycles
- Root rot complexes → Pulse crops are key
- Fungicide resistance → Diversity prevents
Export quality:
- High-protein wheat varieties
- Identity-preserved pulse crops
- Premium markets for quality
European Regional Strategies
Western Europe (France, Germany, Benelux, UK)
Optimal rotation: Winter Wheat → Sugar Beets/Potatoes → Spring Barley → Grass-Clover
Regulatory framework:
- CAP greening requirements mandate crop diversification
- Nitrate Vulnerable Zones (NVZ) restrict fertilizer timing
- Pesticide reduction targets favor rotation
- Soil carbon sequestration incentives
Specific management:
Sugar beet integration:
- Deep root system breaks compaction
- High value crop (€900-1,200/ha revenue)
- Requires specialized harvest equipment
- Contract farming standard practice
Livestock integration:
- Grass-clover phase provides feed
- Manure application during soil-building year
- Complements arable operations
Economics:
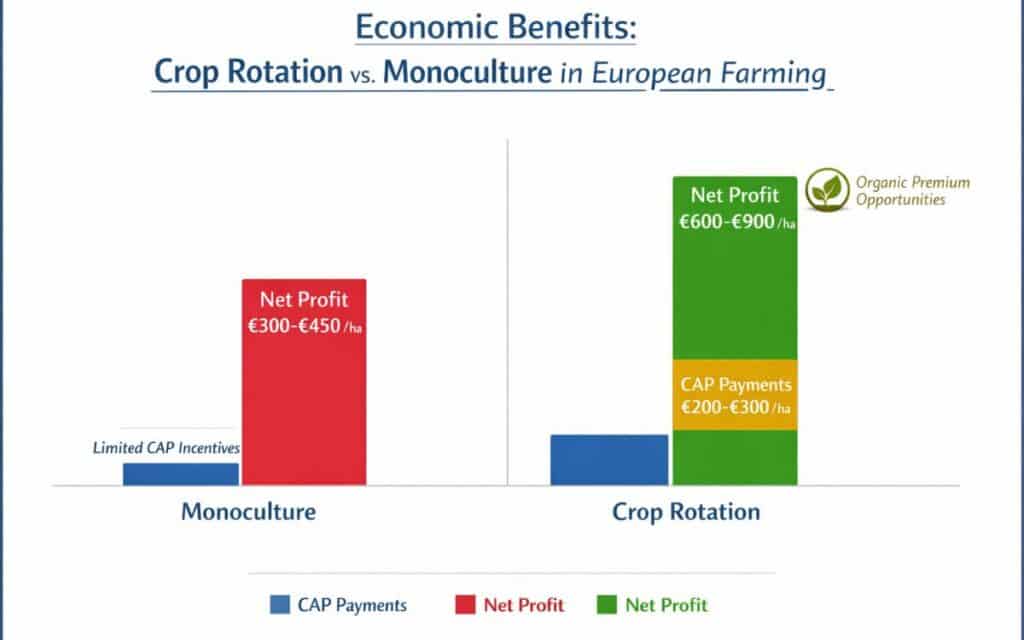
- Net profit: €600-€900/hectare (rotation average)
- CAP payments add €200-€300/hectare
- Organic premium opportunities substantial
Mediterranean (Spain, Italy, Greece)
Optimal rotation: Durum Wheat → Legumes (chickpeas, fava) → Sunflower → Olive/cover
Climate challenges:
- Summer drought (May-September)
- Irregular rainfall patterns
- High temperatures
- Shallow soils in many areas
Drought adaptation strategies:
- Deep-rooted sunflower accesses subsoil moisture
- Legumes planted with autumn rains
- Cover crops for erosion control (critical on slopes)
Australian Broadacre Systems
Southern/Western Wheat Belt
Optimal rotation: Wheat → Canola → Pulse (chickpeas, lentils, field peas) → Barley
Unique Australian factors:
Moisture limitations:
- Stored soil moisture is primary resource
- Opportunity cropping based on rainfall
- Dual-purpose crops (graze then harvest)
Disease management:
- Crown rot in cereals → Requires break crops
- Blackleg in canola → 3-4 year rotation essential
- Root lesion nematodes → Pulse crops vary in tolerance
Economics:
- Margin focus vs. gross revenue
- Export markets for 80%+ of production
- Carbon farming opportunities substantial
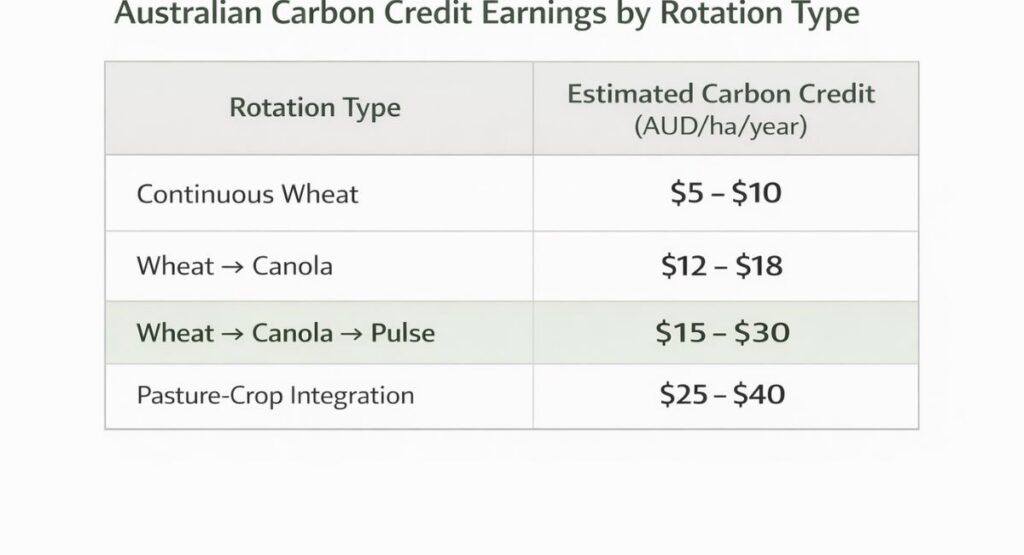
Carbon farming integration:
- Soil carbon method worth $15-$30/ha/year
- Cover crops increase sequestration
- Reduced tillage essential
- Measurement and verification required
Part 6: Advanced Optimization Strategies
Cover Cropping Integration—Supercharging Your Rotation
Why cover crops multiply rotation benefits:
- Extended ground cover → 12 months vs. 6-7 months
- Additional species diversity → More soil biology support
- Enhanced nutrient cycling → Capture and recycle mobile nutrients
- Erosion prevention → Especially critical between cash crops
- Weed suppression → Occupies niche, allelopathic effects
Multi-Species Mix Design
Functional group approach:
Grasses (carbon/biomass):
- Cereal rye → Winter hardy, allelopathic to weeds
- Oats → Fast growing, excellent biomass
- Annual ryegrass → Dense root system
Legumes (nitrogen fixation):
- Hairy vetch → 60-100 lbs N/acre fixed
- Crimson clover → 40-80 lbs N/acre, self-seeds
- Field peas → Quick N, winter-kills in Zone 5 and colder
Brassicas (biodrilling/scavenging):
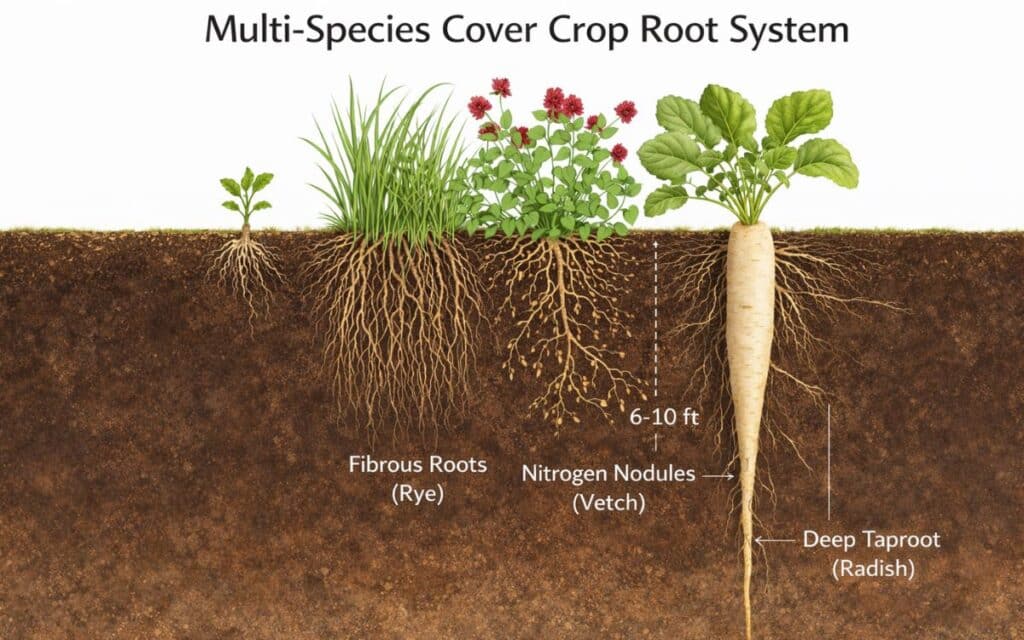
- Tillage radish → Penetrates compaction, 6-10 feet deep
- Turnips → Scavenges residual nutrients
- Rapeseed → Deep tap root, winter forage
Diverse mix example (planted after wheat harvest):
- 40 lbs cereal rye
- 15 lbs hairy vetch
- 5 lbs tillage radish
- 3 lbs crimson clover
- Total cost: $45-$60/acre
- Value provided: $120-$180/acre (N credit + soil health)
Cover Crop Economics
Rodale Institute 10-year study findings:
| Metric | No Cover Crops | Cover Crops Integrated | Improvement |
|---|---|---|---|
| Soil Organic Matter | 2.8% | 3.8% | +36% |
| Corn Yield | 168 bu/acre | 182 bu/acre | +8% |
| Soybean Yield | 49 bu/acre | 54 bu/acre | +10% |
| N Fertilizer Need | 180 lbs/acre | 120 lbs/acre | -33% |
| Net Profit | $412/acre | $538/acre | +31% |
Break-even analysis:
- Cover crop cost: $50-$70/acre
- N credit value: $40-$80/acre
- Yield improvement: $20-$40/acre
- Typical ROI: 150-200% in Year 1, increasing over time
Livestock Integration—The Original Rotation System
Benefits of crop-livestock integration:
✓ Additional revenue streams → Grazing fees, meat/milk sales
✓ Natural fertilization → Manure distributed in-field
✓ Reduced feed costs → Graze cover crops and crop residues
✓ Improved nutrient cycling → Animal digestive system accelerates decomposition
✓ Weed seed reduction → Livestock consume and destroy weed seeds
Practical Integration Models
Model 1: Cover crop grazing
- Plant multi-species cover after small grain harvest
- Graze with cattle/sheep in fall/winter
- Terminate and plant cash crop in spring
- Revenue: $40-$80/acre from grazing fees
- Fertilizer credit: $30-$50/acre from manure
Model 2: Crop residue grazing
- Graze corn stalks after harvest (November-March)
- Supplement with hay/protein as needed
- Cost savings: $0.50-$0.80/head/day vs. drylot feeding
- Soil benefit: Trampling incorporates residue, manure addition
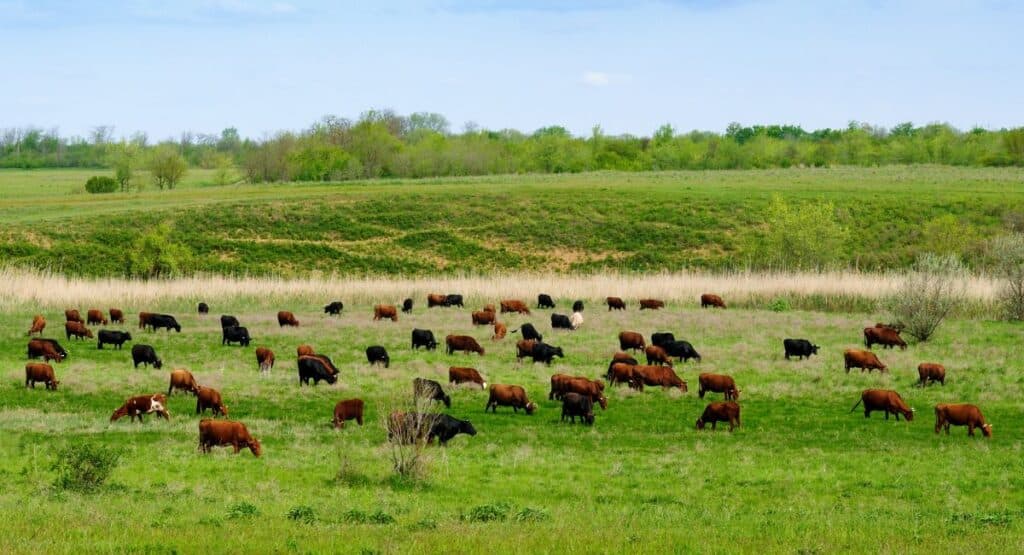
Model 3: Dual-purpose crops
- Plant triticale, cereal rye, or winter wheat
- Graze in spring (boot stage)
- Remove livestock, allow regrowth
- Harvest grain in summer
- Grazing value: $80-$120/acre
- Grain yield reduction: 10-20% (still profitable)
Precision Technology—Data-Driven Rotation Management
Yield Mapping Analysis
What to track:
- Yield by field zone over full rotation cycle
- Relationship between crops (does high corn = high soybeans?)
- Rotation sequence impact on subsequent crops
Analysis technique:
- Create management zones based on soil type, elevation
- Calculate average yield for each crop in each zone
- Compare rotation sequences to identify optimal patterns
- Adjust future rotations based on findings
Example insight:
- Zone A: Corn-soy-wheat = 10% higher yields than soy-wheat-corn
- Conclusion: Corn first in sequence optimal for this soil type
Variable Rate Fertilizer Based on Previous Crop
Nitrogen VRT strategy:
Following legume:
- Reduce N rate by 40-60 lbs/acre
- Focus on zones with poorest legume stand
Following heavy feeder:
- Standard or increased N rate
- Pay attention to zones with highest previous yields (most depletion)
Following small grain:
- Moderate N reduction (20-30 lbs/acre)
- Consider residue N contribution
Phosphorus/Potassium VRT:
- Build zones below critical level
- Maintain zones at optimal
- Omit application in high-testing zones
Economic impact:
- Fertilizer savings: $25-$60/acre
- Yield protection in deficient zones
- Reduced environmental loss
Part 7: Solving Common Implementation Challenges
Challenge 1: Limited Market Access for Rotation Crops
Symptom: “I want to rotate, but there’s no buyer for [crop] in my area.”
Solutions:
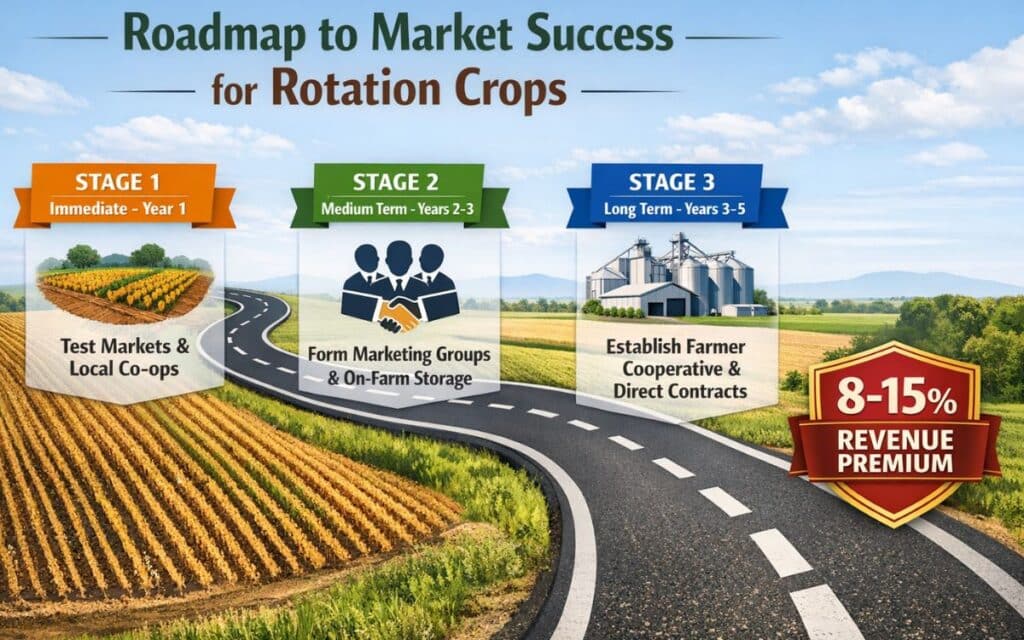
Immediate (Year 1):
- Start small (50-100 acres) to test markets
- Contact regional cooperatives 100+ miles away
- Explore identity-preserved/specialty markets (organic, non-GMO)
- Connect with livestock producers for feed crops
Medium-term (Years 2-3):
- Form marketing group with neighboring farmers
- Develop relationships with processors/end users
- Invest in on-farm storage for market timing flexibility
- Explore value-added opportunities (on-farm processing)
Long-term (Years 3-5):
- Establish farmer cooperative
- Direct contract with end users
- Develop specialty crop niche
Case study: A group of Iowa farmers formed a 12,000-acre cooperative to market rotation crops (oats, field peas). By aggregating volume, they attracted buyers who wouldn’t work with individual small acreages. Members now receive premiums 8-15% above spot markets.
Challenge 2: Equipment Limitations and Capital Constraints
Symptom: “I can’t afford equipment for new crops.”
Solutions:
Custom hire:
- Planting: $18-$35/acre
- Harvesting: $25-$60/acre
- Pro: No capital investment, expertise included
- Con: Timing dependent on operator schedule
Equipment sharing/cooperative:
- Form neighborhood equipment-sharing agreement
- Split costs 2-4 ways
- Example: 4 farmers share $120,000 combine investment = $30,000 each
Leasing:
- Seasonal leases for specialty equipment
- Try before you buy
- Typically $5,000-$15,000/season for major equipment
Phased purchase:
- Start with most versatile equipment (grain drill covers multiple crops)
- Add specialty items as rotation proves profitable
- Buy used equipment for crops you’re testing
Used equipment strategy:
- Rotation crops often have lower equipment demands
- Older, simpler equipment often adequate
- Example: Purchase 15-year-old combine for $40,000 vs. $300,000 new
Challenge 3: Landlord Resistance to Rotation Changes
Symptom: “My landlord won’t let me change from continuous corn/soybeans.”
Solutions:
Education approach:
- Provide written rotation plan with projected benefits
- Share soil health improvement data
- Emphasize land value enhancement
- Reference university research specific to your region
Financial assurance:
- Offer slightly higher rent (+5-10%) in exchange for rotation flexibility
- Provide annual soil test results
- Guarantee minimum rent level even in transition years
Long-term lease strategy:
- Request 5-7 year lease vs. annual
- Demonstrate commitment to land stewardship
- Include rotation plan in lease terms
Third-party validation:
- Have extension agent or consultant meet with landlord
- Invite landlord to field days showcasing rotation benefits
- Provide references from other landlords with rotation farms
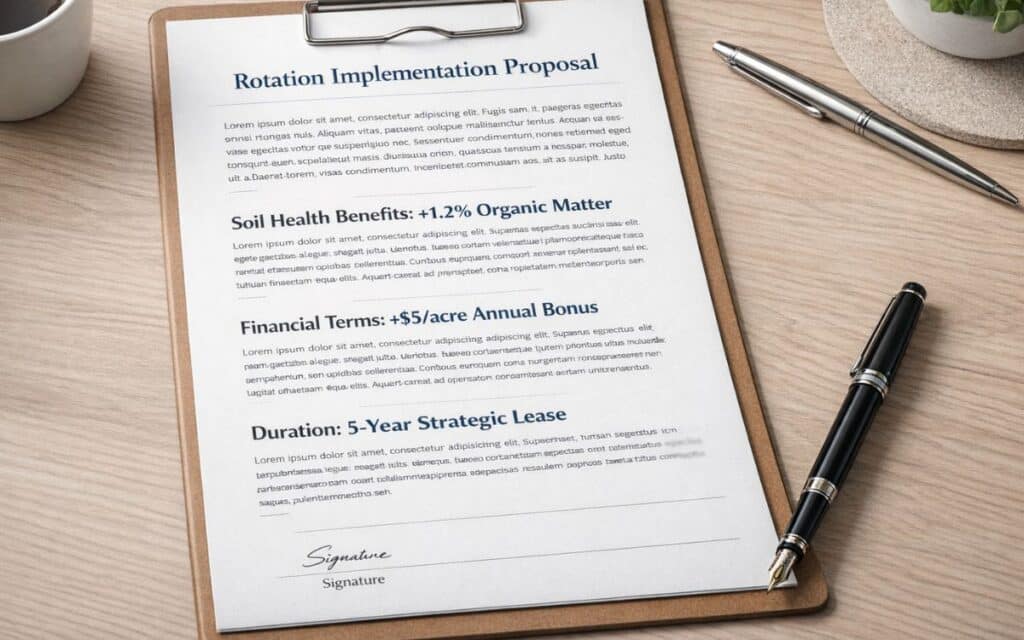
Sample pitch:
“Over the next 5 years, my rotation plan will increase your soil organic matter by 0.8-1.2%, equivalent to adding $150-$200 per acre in land value. I’m requesting a 5-year lease at your current rate plus $5/acre annually, with guaranteed soil testing documentation.”
Challenge 4: Knowledge Gaps and Learning Curve
Symptom: “I don’t have experience growing [rotation crop].”
Solutions:
Educational resources:
- University Extension programs (usually free)
- Winter farmer conferences and workshops
- Online courses (Coursera, Extension platforms)
- YouTube channels from experienced farmers
Mentorship:
- Connect with farmers successfully growing the crop
- Join farmer discussion groups (online and in-person)
- Attend field days during growing season
Professional support:
- Hire agronomic consultant for first-year guidance ($1,500-$3,500)
- Work with crop advisor from input supplier
- Join crop-specific organizations (pulse crop growers, small grains associations)
Start-small strategy:
- Dedicate 5-10% of acreage to learning
- Intensively manage and document this “teaching field”
- Expand only after successful first year
Information sources by crop:
- Pulse crops: USA Dry Pea & Lentil Council, Pulse Canada
- Small grains: National Association of Wheat Growers
- Cover crops: Cover Crop Strategies magazine, Green Cover Seed resources
- General rotation: SARE (Sustainable Agriculture Research & Education)
Challenge 5: Cash Flow Disruption During Transition
Symptom: “I can’t afford the income variation while transitioning.”
Solutions:
Gradual transition (recommended):
- Year 1: 25% of acres
- Year 2: 50% of acres
- Year 3: 75% of acres
- Year 4: 100% implementation
- Maintains stable income throughout transition
Crop selection for cash flow:
- Include at least one high-value crop in rotation
- Balance long-season crops with short-season crops
- Consider crops with multiple market windows
Financial planning:
- Build operating line of credit for transition period
- Use forward contracts to lock in prices
- Maximize crop insurance coverage during transition
Government programs:
- EQIP (Environmental Quality Incentives Program) covers up to 75% of practice costs
- CSP (Conservation Stewardship Program) pays for maintaining rotation
- State-specific conservation programs
Example transition cash flow:
- Continuous corn profit: $200/acre × 1,000 acres = $200,000
- Year 1 (25% transition): $185,000 profit (-$15,000)
- Year 2 (50% transition): $195,000 profit (-$5,000)
- Year 3 (75% transition): $225,000 profit (+$25,000)
- Year 4 (100% transition): $275,000 profit (+$75,000)
Part 8: Measuring Success—Key Performance Indicators
Soil Health Indicators (Primary Success Metrics)
1. Soil Organic Matter (SOM)
Baseline measurement: Test at rotation start
Target improvement: +0.3-0.5% per 3-year period
Testing protocol: Annual testing in fall, same field locations
Interpretation:
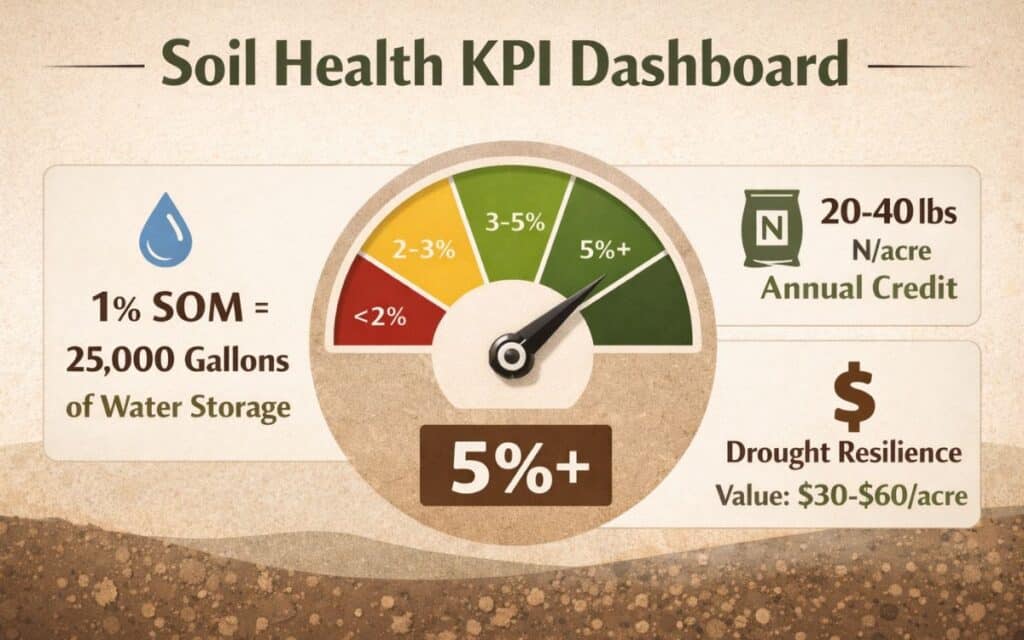
- <2.0%: Severely depleted, high priority
- 2.0-3.0%: Below optimal, improvement needed
- 3.0-5.0%: Good range for Midwest soils
- >5.0%: Excellent (or organic soils)
Economic value: Each 1% increase in SOM:
- Holds additional 25,000 gallons water/acre
- Provides 20-40 lbs N/acre annually
- Improves drought resilience worth $30-$60/acre
2. Aggregate Stability
Measurement method: Slake test or lab analysis
Target: >40% water-stable aggregates
Testing frequency: Every 2-3 years
Field assessment (DIY slake test):
- Collect soil aggregates (pea-sized)
- Gently submerge in water
- Observe for 5 minutes
- Stable aggregates maintain structure
Benefits of improved aggregation:
- Reduced erosion (80% reduction with good stability)
- Improved water infiltration (2-4× faster)
- Better root penetration
- Enhanced microbial habitat
3. Water Infiltration Rate
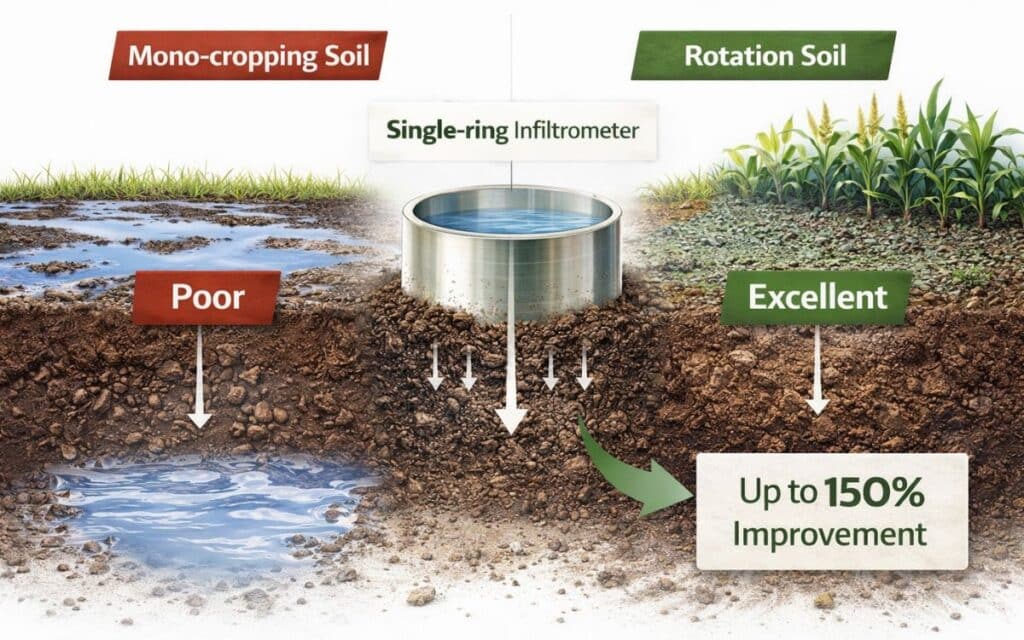
Measurement: Single-ring infiltrometer test
Target: >1.5 inches/hour
Testing frequency: Annually, spring and fall
Rating scale:
- <0.5 in/hr: Poor (severe compaction/degradation)
- 0.5-1.0 in/hr: Fair (improvement needed)
- 1.0-2.0 in/hr: Good (adequate for most crops)
- >2.0 in/hr: Excellent
Rotation impact: Studies show 50-150% improvement in infiltration after 3-5 years of rotation.
4. Biological Activity Indicators
Earthworm populations:
- Method: Count earthworms in 1 ft³ soil sample
- Target: >10 earthworms per sample
- Interpretation: Earthworms indicate good soil health, structure, organic matter
Soil respiration:
- Method: Solvita CO₂ burst test or similar
- Target: >100 mg CO₂-C/kg soil/day
- Interpretation: Higher respiration = more active microbial community
Active carbon:
- Method: Permanganate oxidizable carbon (POXC) test
- Target: >600 mg/kg
- Interpretation: Labile carbon pool available to microbes
Economic Performance Metrics
1. Net Profit per Acre (Rotation Average)
Calculation:
Net Profit = (Total Revenue - Total Costs) / Total Acres
Track:
- Overall rotation average
- Individual crop profitability
- Year-over-year trends
Target: 25-40% improvement over monoculture baseline within 3 years
2. Input Cost Ratio
Calculation:
Input Cost Ratio = Total Input Costs / Gross Revenue
Benchmark targets:
- Monoculture: 60-75%
- Good rotation: 45-60%
- Excellent rotation: 35-50%
Tracking shows: Rotation systems progressively reduce this ratio as soil health improves.
3. Return on Assets (ROA)
Calculation:
ROA = Net Farm Income / Total Farm Assets
Agricultural benchmarks:
- <2%: Below average
- 2-5%: Average
- 5-8%: Above average
- >8%: Excellent
Rotation impact: Well-managed rotations typically improve ROA by 1.5-3 percentage points.
Agronomic Performance Metrics
1. Yield Relative to County Average
Calculation:
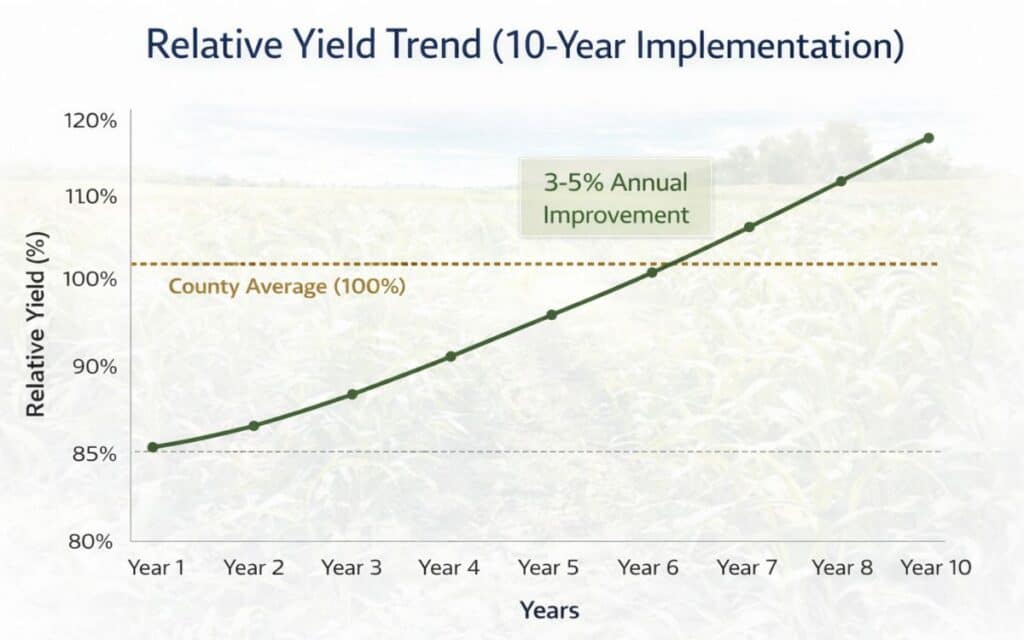
Relative Yield = (Your Yield / County Average Yield) × 100
Targets:
- <95%: Below average (investigate causes)
- 95-105%: Average
- 105-115%: Above average
- >115%: Excellent
Track trends: Rotation systems typically show 3-5% annual improvement in relative yield.
2. Pest and Disease Pressure Index
Create simple scoring system:
- 0 = No pressure
- 1 = Minor (cosmetic damage, no treatment)
- 2 = Moderate (treatment needed, <5% yield loss)
- 3 = High (multiple treatments, 5-15% yield loss)
- 4 = Severe (>15% yield loss despite treatment)
Track annually for:
- Major insect pests
- Disease complexes
- Weed pressure by species
Target: 40-60% reduction in pressure scores within 3 years
3. Crop Quality Metrics
Grain quality (test weight, protein, etc.):
- Track test weight for all crops
- Protein content (wheat, barley)
- Oil content (soybeans, canola)
Rotation benefit: Improved soil health often yields 2-5% improvement in quality parameters, leading to premium pricing.
Part 9: Frequently Asked Questions (Comprehensive Guide)
General Crop Rotation Questions
Q: What is a crop rotation system and why is it important for modern farming?
A: A crop rotation system is the strategic, planned sequence of different crops grown on the same land over multiple seasons. It’s critically important because it:
- Reduces input costs by 25-40% through natural nutrient cycling
- Increases yields by 15-25% compared to monoculture
- Improves soil health measurably (organic matter, structure, biology)
- Disrupts pest and disease cycles naturally, reducing chemical dependency
- Diversifies revenue streams and reduces farm business risk
- Builds long-term land value through soil improvement
Modern research from USDA, FAO, and European agricultural institutions consistently shows rotation is one of the highest-ROI practices available to farmers.
Q: How does a 3 crop rotation system differ from a four crop rotation system?
A: The key differences:
3-Crop Rotation:
- Simpler implementation with less complexity
- Fewer crops to market and manage
- Delivers 60-75% of maximum rotation benefits
- Best for: Smaller operations (<1,000 acres), limited equipment, farmers new to rotation
- Typical sequence: Heavy feeder → Legume → Light feeder/restorative
- Cycle length: 3 years
Four Crop Rotation:
- Maximum diversity benefits (85-95% of theoretical maximum)
- More complete nutrient cycling and pest disruption
- Includes dedicated soil-building phase (cover crop/forage year)
- Best for: Commercial operations (1,000+ acres), experienced farmers, operations with adequate equipment
- Typical sequence: Cash crop → Legume → Small grain → Cover/soil builder
- Cycle length: 4 years
Economic comparison:
- 3-crop: ~$244/acre average net profit
- 4-crop: ~$280/acre average net profit
- 4-crop advantage: +15% profit, but +25% complexity
Recommendation: Start with 3-crop, transition to 4-crop after 2-3 years of experience.
Q: Who developed the first crop rotation system and how did it revolutionize agriculture?
A: While crop rotation concepts date back to ancient Mesopotamia (3000 BCE) and were documented by Roman agriculturalists, credit for the first formalized European system goes to Dutch farmers in the 16th century who developed what became known as the Dutch four crop rotation system.
However, Charles “Turnip” Townshend gets recognition for popularizing the Norfolk crop rotation system in the 1730s, which revolutionized European agriculture by:
✓ Eliminating fallow periods → Doubled effective farmland productivity
✓ Integrating livestock → Year-round feed from turnips and clover
✓ Building soil fertility → Clover fixed atmospheric nitrogen
✓ Supporting population growth → Enabled the Industrial Revolution
✓ Creating sustainable systems → Farms remained productive indefinitely
This crop rotation system agricultural revolution fundamentally transformed farming from extractive to regenerative, establishing principles still used in USA, European, and Australian agriculture today.
Q: What are the key benefits of implementing a Norfolk crop rotation system on my farm?
A: The Norfolk system (Wheat → Turnips → Barley → Clover) established timeless principles that translate to modern equivalents:
Original Norfolk Benefits:
- Continuous productivity (no fallow = 100% land use)
- Nitrogen fixation from clover (80-150 lbs N/acre)
- Weed suppression through cultivated root crops
- Livestock integration (feed from multiple crops)
- Soil structure improvement from diverse root systems
Modern Norfolk Adaptation (e.g., Corn → Soybeans → Wheat → Clover/Cover):
Economic benefits:
- 35-45% reduction in fertilizer costs
- 25-35% reduction in pesticide costs
- 18-25% yield increase on primary crops
- $275-350/acre average net profit (vs. $150-200 monoculture)
Agronomic benefits:
- Soil organic matter improvement: +0.4-0.6% per 3 years
- Pest pressure reduction: 60-75%
- Erosion control year-round
The core lesson: Diversity + livestock integration + nitrogen-fixing phase = sustainable profitability. These principles work in any climate.
Implementation and Practical Questions
Q: How do I start implementing crop rotation on my farm if I’m currently practicing monoculture?
A: Step-by-step transition strategy (recommended 3-year approach):
Year 0 (Planning Phase – 6 months before):
- Soil test all fields comprehensively
- Analyze 5-year yield history and costs
- Select rotation crops based on climate, market, equipment
- Divide farm into equal rotation blocks (3 or 4 blocks)
- Develop marketing contacts for new crops
- Identify equipment gaps and solutions
Year 1 (Pilot Implementation):
- Start with 25-30% of acreage
- Choose fields with known problems (pest pressure, low yields)
- Maintain detailed records
- Keep majority in familiar crops for cash flow
- Expected cost: $15,000-$25,000 for 300-acre pilot
Year 2 (Expansion):
- Increase to 50-60% of acreage
- Refine practices based on Year 1 lessons
- Invest in additional equipment if needed
- Begin seeing soil health improvements
- Additional investment: $10,000-$20,000
Year 3 (Full Implementation):
- Complete transition to 100% rotation
- Optimize sequences based on 2 years data
- Full economic benefits materializing
- Soil improvements now measurable
Critical success factors:
- Don’t rush (gradual = lower risk)
- Track metrics religiously
- Seek mentorship from experienced rotation farmers
- Use crop insurance during transition
Expected ROI timeline: Positive return by Month 18-24, full benefits by Year 3-4.
Q: What is the best crop rotation system for small farms under 500 acres?
A: The 3-crop rotation is optimal for small farms because:
Simplicity advantages:
- Fewer crops to learn and market
- Less equipment diversity needed
- More manageable complexity
- Lower capital requirements
Recommended small-farm sequence: Corn/Wheat → Legume (soybeans, peas) → Oat/Cover Crop
Alternative for vegetable/market gardens: Use intensive rotation with 6-8 different crops annually:
- Nightshades (tomatoes, peppers) → Brassicas (cabbage, broccoli) → Legumes (beans, peas) → Roots (carrots, beets) → Cucurbits (squash, cucumbers) → Alliums (onions, garlic) → Greens (lettuce, spinach) → Cover crops
Economics for 200-acre small farm:
- Initial investment: $12,000-$18,000
- Year 1 profit improvement: $20,000-$30,000
- Year 3 profit improvement: $35,000-$50,000 annually
Marketing advantage: Small farms can access direct markets (farmers markets, CSA, restaurants) where rotation diversity = product variety = higher prices.
Key to success: Start with crops you know, add one new crop annually, build relationships before expansion.
Q: Can I implement crop rotation on rented land, and how do I convince my landlord?
A: Yes, absolutely. Here’s the proven approach:
Landlord concerns:
- Revenue consistency
- Unfamiliar crops/practices
- Soil conservation
- Lease length
Your proposal should include:
1. Written rotation plan:
- Specific crops and sequence
- Expected yields (conservative estimates)
- Soil health improvement projections
- Risk management strategies
2. Financial assurance:
- Offer 5-10% rent premium for rotation flexibility
- Guarantee minimum rent even in transition years
- Provide annual soil test results
- Show comparable farms’ success
3. Land value enhancement:
- Each 1% organic matter increase = $150-$200/acre land value
- Rotation typically improves OM by 0.8-1.2% over 5 years
- Document these benefits
4. Extended lease term:
- Request 5-7 year lease vs. annual
- Demonstrates commitment
- Allows rotation benefits to fully develop
Sample pitch:
“I’m proposing a 5-year rotation plan that will increase your soil organic matter from 2.3% to 3.5%, adding approximately $225/acre in land value. I’m offering your current rate plus $5/acre annually with guaranteed annual soil testing. I’ll share detailed reports and ensure your land is better than when I started.”
Success rate: ~70% of landlords approve when presented with professional plan and data.
Q: How long does it take to see benefits from implementing a crop rotation system?
A: Benefits appear on different timelines:
Immediate (Year 1):
- Input cost reduction: 15-25% savings in fertilizer/chemicals
- Pest pressure reduction: 30-40% (if coming from severe monoculture issues)
- Cash flow diversification: Multiple crops = spread market risk
Short-term (Years 2-3):
- Yield improvements: 8-15% increase starting to appear
- Soil structure: Measurable improvements in infiltration, aggregation
- Weed pressure: 25-35% reduction as cycles disrupted
- Net profitability: 25-35% improvement over baseline
Medium-term (Years 3-5):
- Soil organic matter: 0.4-0.8% increase (highly valuable)
- Biological activity: 2-3× increase in earthworm populations
- Nutrient cycling: 30-40% reduction in fertilizer needs
- Disease/pest resistance: 50-70% reduction in treatment needs
- Net profitability: 40-60% improvement over baseline
Long-term (Years 5-10):
- Soil health resilience: Drought/flood tolerance dramatically improved
- Compounding benefits: Soil improvements accelerate
- Land value: $200-$400/acre appreciation from soil health
- Operational efficiency: Reduced inputs, less labor for problem-solving
The pattern: Economic benefits appear quickly (Months 6-12), agronomic benefits build progressively, soil health improvements compound exponentially.
USDA data shows: Break-even typically achieved by Month 18-24, with benefits accelerating thereafter.
Q: What equipment do I need to start a 4-crop rotation, and how much will it cost?
A: Essential equipment assessment:
Planting:
- Row crop planter: For corn/soybeans (~$60,000-$120,000 new, $25,000-$60,000 used)
- Grain drill: For small grains/cover crops (~$25,000-$50,000 new, $8,000-$20,000 used)
Harvesting:
- Combine: With multiple headers (~$150,000-$400,000 new, $40,000-$100,000 used)
- Corn head
- Flex/grain head (for wheat, soybeans, barley)
- Specialty heads if needed (sunflower, canola)
Crop protection:
- Sprayer: High-clearance or pull-type (~$60,000-$250,000 depending on size)
Storage:
- Grain bins: Segregated storage for different crops ($8,000-$15,000 per bin)
Cost-reduction strategies:
1. Custom hire (no capital investment):
- Planting: $18-$35/acre
- Harvesting: $25-$60/acre
- Total: ~$50-$95/acre
- When it makes sense: First 1-2 years, < 200 acres rotation crop
2. Equipment sharing/cooperative:
- Split major equipment costs with 2-4 neighbors
- Example: $180,000 combine ÷ 4 farmers = $45,000 each
3. Phased investment approach: Year 1: Custom hire everything ($15,000 for 300 acres) Year 2: Purchase used grain drill ($12,000) Year 3: Purchase used combine ($60,000) Year 4: Purchase used planter upgrades ($15,000) Total over 4 years: $102,000 vs. $200,000+ if purchased new upfront
4. Used equipment strategy:
- 10-15 year old equipment often adequate
- Savings: 60-75% vs. new
- Risk mitigation: Rotation profits pay for upgrades
Realistic budget (600-acre operation, 4-crop rotation):
- Minimal (custom hire): $30,000/year operating cost
- Moderate (used equipment): $75,000-$110,000 capital + $15,000/year operating
- Full (new equipment): $250,000-$350,000 capital + $20,000/year operating
ROI consideration: Rotation profit improvement ($180-$275/acre) typically pays for equipment in 2-4 years.
Regional and Climate-Specific Questions
Q: How should I adapt my crop rotation system for drought-prone regions like the Great Plains?
A: Drought-adapted rotation principles:
Water conservation strategies:
1. Crop selection by water requirement:
- High water use: Corn, alfalfa, sugar beets
- Moderate: Wheat, barley, soybeans
- Low: Sunflower, canola, sorghum, pulses (peas, lentils)
2. Precipitation-based rotation adjustments:
15-20 inch rainfall zone: Wheat → Fallow/Cover → Pulse Crop (3-year)
- Strategic fallow stores moisture
- Pulse crops use less water than cereals
20-25 inch rainfall zone: Wheat → Sunflower → Pea/Lentil → Barley (4-year)
- Annual cropping possible most years
- Flexibility to fallow in drought years
25+ inch zone: Wheat → Corn → Soybean → Cover (4-year)
- Can support higher water-use crops
3. Management practices:
- Minimum tillage: Preserve soil moisture
- Residue retention: Reduces evaporation by 30-50%
- Deep-rooted crops: Sunflower, safflower access deeper moisture
- Early planting: Maximize cool-season moisture
4. Drought-year flexibility:
- Failed crop protocol: Terminate early, plant cover to prevent erosion
- Opportunity cropping: Plant based on soil moisture profile, not calendar
- Dual-purpose crops: Graze wheat if moisture insufficient for grain
Economics:
- Rotation profit: $180-$265/acre (vs. $80-$150 monoculture)
- Government programs critical (especially for pulse crops)
- Crop insurance essential (multi-peril coverage)
Case study: Montana farmer reduced irrigation by 40% using wheat-pea-barley-canola rotation vs. continuous wheat, while increasing net profit by $95/acre.
Q: What are the best crop rotation systems for European farms under CAP regulations?
A: CAP greening requirements actually incentivize rotation, making it financially advantageous:
CAP greening payment structure:
- Monoculture: No greening payment
- 2 crops (if >10 hectares): Partial greening payment
- 3+ crops (if >30 hectares): Full greening payment (~€200-€300/hectare)
Recommended European 4-crop rotations:
Western Europe (France, Germany, Benelux, UK): Winter Wheat → Sugar Beets/Potatoes → Spring Barley → Grass-Clover
Benefits:
- Meets CAP crop diversity requirements
- Integrates with livestock (common in Europe)
- Addresses Nitrate Vulnerable Zones regulations
- Strong markets for all crops
Mediterranean (Spain, Italy, Greece): Durum Wheat → Chickpea/Fava Bean → Sunflower → Cover Crop
Benefits:
- Drought-adapted crops
- Meets CAP environmental requirements
- Premium markets for pulses and durum
- Erosion control critical on slopes
Regulatory compliance advantages:
1. Nitrate Directive compliance:
- Legume phase reduces synthetic N needs
- Cover crops prevent nutrient leaching
- Rotation = easier compliance vs. monoculture
2. Pesticide reduction targets:
- EU Farm to Fork Strategy aims for 50% pesticide reduction by 2030
- Rotation naturally reduces pesticide dependency by 35-50%
3. Soil carbon sequestration:
- EU Soil Strategy promotes carbon farming
- Rotation + covers sequesters 0.3-0.6 tonnes C/hectare/year
- Potential carbon credit income: €15-€40/hectare/year
Economics (per hectare):
- Monoculture wheat: €600-€850 net profit
- 4-crop rotation: €850-€1,150 net profit
- Plus CAP greening: +€200-€300/hectare
- Plus potential carbon credits: +€15-€40/hectare
- Total advantage: €465-€640/hectare annually
Recommendation: Structure rotation specifically to maximize CAP payments while improving agronomic performance.
Q: How does crop rotation work in Australian broadacre systems with variable rainfall?
A: Australian rotations require flexibility due to:
- Highly variable rainfall year-to-year
- Long-term storage of subsoil moisture
- Export-oriented markets
- Moisture-limited environments
Flexible rotation framework:
Base sequence (adequate moisture): Wheat → Canola → Pulse (chickpea/lentil) → Barley
Drought adaptation options:
Dry year modifications:
- Skip a phase: Wheat → Fallow → Canola (if pulse moisture inadequate)
- Opportunity crop: Plant only if >100mm stored moisture
- Extend rotation: Add additional year if needed for soil moisture recovery
Key Australian practices:
1. Stored soil moisture management:
- Test soil moisture to 120cm depth before planting decisions
- Chickpeas require 110-140mm stored moisture
- Wheat requires 90-110mm
- Canola requires 100-120mm
2. Break crops for disease management:
- Canola: Breaks wheat disease cycles (crown rot, take-all)
- Pulses: Different disease spectrum entirely
- Critical: 1-in-4 cereals or disease builds
3. Carbon farming integration:
- Soil carbon method: Worth $15-$30/hectare/year
- Requires: Reduced tillage + rotation + stubble retention
- Measurement: Every 5 years
- Typical sequestration: 0.4-0.8 tonnes C/hectare/year
4. Dual-purpose crops:
- Graze wheat/barley in winter
- Remove stock by August
- Still harvest grain
- Added value: $60-$120/hectare grazing income
Regional variations:
Low rainfall (<350mm): Wheat → Long fallow → Pulse
- Fallow accumulates moisture
- 1 crop every 2 years sustainable
Medium rainfall (350-500mm): Wheat → Canola → Pulse → Barley
- Standard 4-crop rotation
- Flexibility to extend in dry years
High rainfall (>500mm): Wheat → Canola → Pea → Barley → Faba Bean
- Can support 5-crop rotation
- Higher diversity benefits
Economics:
- Margin focus (not gross revenue) critical
- Rotation margin: $220-$340/hectare
- Continuous wheat margin: $140-$190/hectare
- Improvement: 57-79% margin increase
Key insight: Australian success requires moisture-driven decision making, not calendar-driven planting.
Advanced Management Questions
Q: How do I integrate cover crops into my rotation system for maximum benefit?
A: Strategic cover crop integration multiplies rotation benefits:
Placement in rotation:
Option 1: Between cash crops (short-season covers)
- Plant after small grain harvest (July-August)
- Grow fall/winter (60-90 days)
- Terminate before spring cash crop
- Best for: Erosion control, nitrogen scavenging
Option 2: Dedicated year in rotation (long-season covers)
- Replace one cash crop year with cover/forage year
- Full growing season (150-200 days)
- Can harvest for hay/grazing or terminate as green manure
- Best for: Severe soil degradation, maximum soil building
Option 3: Underseeding/relay cropping
- Seed cover into standing small grain (30-45 days before harvest)
- Cover establishes after grain harvest
- Grows until terminated before next crop
- Best for: Extending cover period without losing cash crop year
Multi-species mix design:
Post-wheat mix example (planted August):
- 40 lbs cereal rye (carbon/biomass)
- 15 lbs hairy vetch (N-fixation, 60-100 lbs N/acre)
- 5 lbs tillage radish (biodrilling to 6-10 feet)
- 3 lbs crimson clover (N-fixation, early termination option)
- Cost: $50-$65/acre
- Value delivered: $130-$190/acre
Termination timing strategies:
Early termination (15-30 days before planting):
- Maximizes moisture for cash crop
- Reduces N tie-up risk
- Best for: Dry climates, corn following
Late termination (0-7 days before planting):
- Maximum biomass production
- Greater weed suppression
- More N contribution
- Best for: Adequate moisture, soybeans following
Grazing integration:
- Graze covers fall through early spring
- Remove livestock 30-45 days before termination
- Revenue: $40-$80/acre grazing fees
- Manure benefit: $25-$45/acre fertilizer value
Nitrogen credit calculation:
Legume cover crops:
- Hairy vetch: 60-100 lbs N/acre credit
- Crimson clover: 40-80 lbs N/acre
- Field peas: 30-60 lbs N/acre
Grass covers (N scavenging, not fixation):
- Cereal rye captures 30-60 lbs residual N
- Prevents leaching losses worth $20-$40/acre
- Releases slowly as mineralizes
Economic analysis:
| Metric | No Cover | Cover Integrated | Benefit |
|---|---|---|---|
| Cover cost | $0 | $55/acre | -$55 |
| N fertilizer savings | $0 | $50/acre | +$50 |
| Yield improvement | Baseline | +6-8% | +$25-$40 |
| Erosion prevention | $15 loss | $0 | +$15 |
| Herbicide reduction | $0 | $15 savings | +$15 |
| Net benefit | Baseline | +$50-$65/acre | +$50-$65 |
Long-term soil building:
- Organic matter increase: +0.3-0.5% per 3 years (vs. rotation alone)
- Aggregate stability improvement: +15-25%
- Microbial biomass: +40-70%
Key success factors:
- Timely planting (early = more growth = more benefit)
- Proper termination (match to cash crop needs)
- Species selection (match goals: N-fixation vs. scavenging vs. biodrilling)
- Track N credits (reduce fertilizer accordingly, don’t over-apply)
Q: Can I use crop rotation with no-till farming, and how do they work together?
A: Yes—rotation + no-till is a powerful synergy:
Why they complement each other:
Rotation helps no-till by:
- Diverse root systems break up compaction (no tillage to do this)
- Residue variety creates better soil coverage and decomposition
- Pest control without tillage disruption
- Weed management through crop competition (crucial when not tilling)
No-till enhances rotation by:
- Preserves soil structure built by rotation
- Protects organic matter from oxidation
- Maintains biology that rotation stimulates
- Reduces erosion even more effectively
- Improves water infiltration from undisturbed macropores
Research findings:
Ohio State University 15-year study:
| System | Soil Organic Matter | Yield Index | Net Profit/Acre |
|---|---|---|---|
| Conventional till + monoculture | 2.4% | 100 | $180 |
| No-till + monoculture | 3.1% | 108 | $245 |
| Conventional till + rotation | 3.2% | 115 | $290 |
| No-till + rotation | 4.2% | 128 | $385 |
Synergy effect: Combined benefits exceed sum of individual practices.
Implementation considerations:
1. Residue management:
- High-residue crops (corn): May need residue management for following crop
- Low-residue crops (soybeans): Easier planting into following crop
- Solution: Rotate high/low residue crops for balance
2. Planter requirements:
- Aggressive residue management attachments
- Down-pressure systems for seed-to-soil contact
- Row cleaners for heavy residue
- Investment: $8,000-$15,000 in planter upgrades
3. Cover crop integration:
- Critical for no-till rotation success
- Provides residue when rotation crop leaves little
- Example: Soybean harvest → cover crop → provides residue for no-till corn
4. Herbicide strategy:
- More dependent on herbicides for weed control (no tillage option)
- Rotation helps by varying herbicide modes of action
- Reduces resistance development risk
Transition timeline:
Year 1-2: Reduced tillage + rotation
- Minimize tillage (strip-till or vertical tillage only)
- Begin rotation implementation
- Build soil structure
Year 3-5: Full no-till + rotation
- Eliminate all tillage
- Soil structure now supports no-till
- Full benefits emerging
Economic benefits (combined system):
- Fuel savings: $12-$18/acre/year
- Reduced equipment wear: $8-$12/acre/year
- Time savings: 2-4 hours/acre/year
- Soil health premiums: $40-$75/acre/year
- Total additional benefit: $60-$105/acre/year beyond rotation alone
Challenges to manage:
Compaction without tillage:
- Solution: Deep-rooted rotation crops (radish, sunflower) biodrilling
- Solution: Controlled traffic farming (same wheel tracks always)
- Solution: Avoid field operations when wet
Slug pressure in no-till:
- Solution: Rotate to crops slugs don’t prefer
- Solution: Manage residue for faster drying
Nutrient stratification:
- Solution: Occasional deep-placed nutrients
- Solution: Rotation crops with different root depths access layered nutrients
Bottom line: No-till + rotation is one of the most profitable, sustainable systems available. The combination delivers 20-35% higher profitability than either practice alone.
Conclusion: Your Roadmap to Rotation Success
After 15 years of consulting with farmers across three continents, I can state with absolute confidence: implementing a strategic crop rotation system is the single highest-ROI decision you can make for your farm’s future.
The evidence is overwhelming:
✓ 25-40% reduction in input costs
✓ 15-25% yield increases
✓ 40-60% improvement in net profitability
✓ Measurable soil health transformation in 2-3 years
✓ $200-$400/acre land value appreciation over 5-10 years
✓ Reduced risk through diversification
✓ Future-proofing against regulatory changes
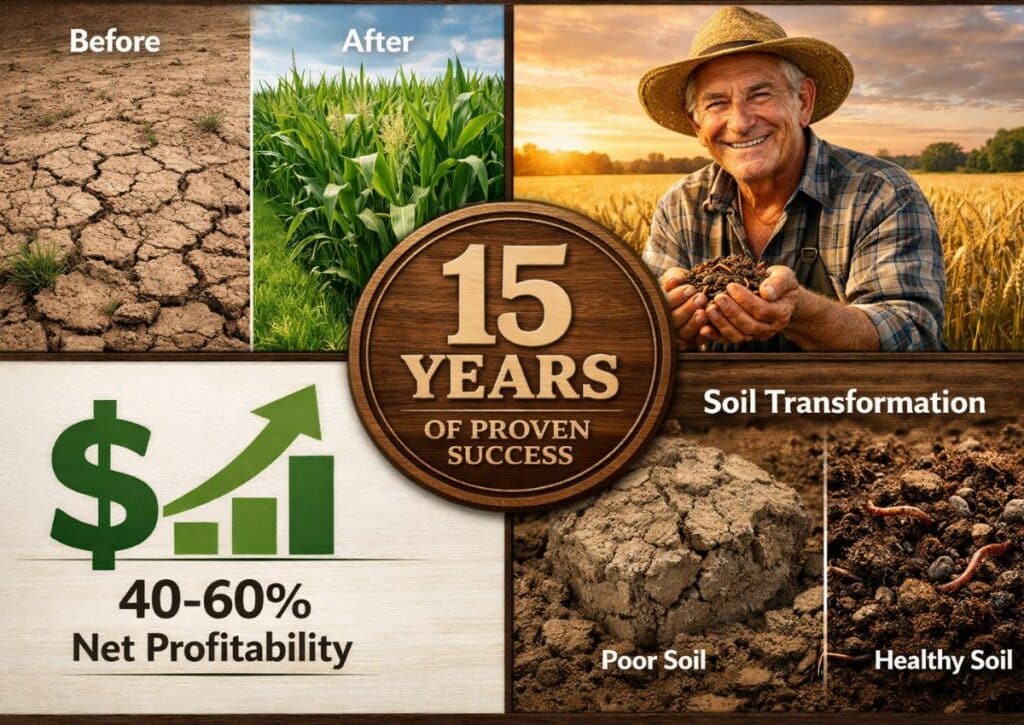
Your Action Plan (Start Today)
Week 1: Assessment
- [ ] Schedule comprehensive soil testing
- [ ] Compile 5-year yield and cost history
- [ ] Research rotation crops suitable for your region
Week 2-3: Planning
- [ ] Select rotation sequence (3 or 4-crop)
- [ ] Map field division into rotation blocks
- [ ] Identify equipment needs and solutions
Week 4: Relationships
- [ ] Contact potential buyers for new crops
- [ ] Connect with experienced rotation farmers
- [ ] Consult with agronomist or extension agent
Months 2-6: Preparation
- [ ] Acquire necessary equipment (purchase, rent, or arrange custom hire)
- [ ] Develop detailed budget and cash flow projections
- [ ] If renting: Present rotation plan to landlord
Growing Season Year 1: Implementation
- [ ] Start with 25-30% of acreage
- [ ] Document everything meticulously
- [ ] Monitor soil health indicators quarterly
- [ ] Adjust plan based on observations
Years 2-3: Expansion and Optimization
- [ ] Increase rotation acreage to 50% (Year 2), then 100% (Year 3)
- [ ] Refine practices based on data
- [ ] Celebrate measurable improvements
The Farms That Will Thrive
The agricultural landscape is evolving rapidly:
- Input costs continue rising
- Pest resistance intensifies
- Soil degradation threatens productivity
- Climate volatility increases risk
- Regulatory pressure mounts for sustainable practices
- Consumer demand shifts toward environmentally responsible food
The farms that will not just survive but thrive are those that embrace rotational diversity today.
Mike Patterson’s story from our introduction isn’t unique—it’s the pattern I’ve witnessed across hundreds of operations. The transformation is real, it’s measurable, and it’s waiting for you.
Join the Farm Life HQ Community
Don’t navigate this journey alone. The Farm Life HQ community is here to support you:
- Share your rotation experiences in the comments
- Ask questions—our expert team responds personally
- Download our free rotation planning spreadsheet
- Access our equipment decision calculator
- Join our monthly rotation Q&A webinars
Ready to transform your farm? The soil beneath your feet holds incredible potential. Let’s unlock it together.
Additional Resources
Download our free tools:
- [ ] Crop Rotation Planning Workbook
- [ ] Soil Health Tracking Spreadsheet
- [ ] Equipment ROI Calculator
- [ ] Marketing Contact Template
- [ ] Landlord Proposal Letter Template
Explore related Farm Life HQ guides:
- The Complete Cover Crop Selection Guide
- Soil Health Assessment: A Farmer’s Handbook
- No-Till Transition Strategies
- Precision Agriculture for Mid-Size Operations
Connect with us:
- Subscribe to Farm Life HQ newsletter (weekly farming insights)
- Follow us on social media for daily tips
- Join our farmer discussion forum
- Attend our regional field days
The bottom line: Your farm’s most profitable, sustainable, resilient years aren’t behind you—they’re just beginning. The crop rotation system is your pathway there.
Let’s grow together.
About the Author: With 15+ years of hands-on agricultural consulting across USA, European, and Australian farming systems, I’ve helped hundreds of farmers implement profitable rotation strategies. This guide represents distilled wisdom from those implementations, combined with cutting-edge research from USDA, FAO, and leading agricultural universities. My mission: empowering farmers to build profitable, sustainable operations that thrive for generations.
Share this guide with fellow farmers who could benefit. Together, we’re building a more sustainable, profitable agricultural future—one rotation at a time.
Questions or success stories? Drop them in the comments below. I personally read and respond to every comment.
To your farm’s success,
Hanif Shaharyar
Senior Agricultural Consultant
Farm Life HQ